Geography of London

Last updated

Outline of the London region Greater london outline map bw.png
Outline of the London region

London is the largest urban area and the capital city of the United Kingdom. It lies in the southeastern part of the island of Great Britain. The London region covers 1,579 square kilometres (610 sq mi), and had a population of 8.982 million in 2019 and a population density of 5,596 people per square km in 2021. A larger area—the London Metropolitan Region or the London Metropolitan Agglomeration—covers 8,382 square kilometres (3,236 sq mi) and had 12,653,500 people, at a density of 1,510 per square kilometre. [1]

Contents

London is a port on the Thames (see main article Port of London ), a navigable river. The river has had a major influence on the development of the city. London began on the Thames' north bank and for a long time the main focus of the city remained on the north side of the Thames. For many centuries London Bridge was the only bridge in or close to the city. When more bridges were built in the 18th century, the city expanded in all directions as the mostly flat or gently rolling countryside presented no obstacle to growth.

360 degree panorama

London 360 from St Paul's Cathedral - Sept 2007.jpg
A panorama of modern London, taken from the Golden Gallery of Saint Paul's Cathedral

Rivers and canals

River Thames

The River Thames is the main river of London, flowing west to east across the London Basin. The river cuts into the London basin through the Goring Gap, draining parts of the Cotswolds and Vale of Aylesbury to the west. Similarly tributaries such as the Mole cut through the North Downs into the basin from the south. Further downstream the flow of the Thames is boosted by springs which open onto the chalky riverbed.

The Thames was once a much broader, shallower river than it is today. It has been extensively embanked. The Thames is tidal (the Tideway) up to Teddington Lock, and London is vulnerable to flooding by storm surges. The threat has increased over time due to a slow but continuous rise in high water level, caused by both the slow 'tilting' of Britain (up in the north and down in the south) caused by post-glacial rebound and the gradual rise in sea levels due to climate change. The Thames Barrier was constructed across the Thames at Woolwich in the 1970s to deal with this threat, but in early 2005 it was suggested that a ten-mile-long (16 km) barrier further downstream might be required to deal with the flood risk in the future. [2] Within London a considerable number of rivers and streams flow into the Thames, some large enough to have exerted a significant influence on the geography of the area. Many of the smaller London tributaries now flow underground.

Satellite image by Sentinel-2 satellite London by Sentinel-2.jpg
Satellite image by Sentinel-2 satellite

Left bank tributaries

Larger left bank tributaries include the Colne, Crane, Brent, Lea (tidal reach known as 'Bow Creek'), Roding (tidal reach known as 'Barking Creek'), Rom (lower reaches known as the Beam) and Ingrebourne. There are many smaller, now often largely subterranean streams including Stamford Brook, Counter's Creek (also known as 'Chelsea Creek'), Westbourne, Tyburn, Tyburn Brook, Fleet and Walbrook. Some of the tributaries are themselves large enough to have named tributary streams, for example the Moselle, Salmons Brook and Pymmes Brook that feed the Lea, and the Silk Stream and Dollis Brook that feed the Brent.

Larger rivers such as the Lea have influenced local geography in several ways:

The valley also became very important for London's water supply, as the source of the water transported by the New River aqueduct, but also as the location for the Lee Valley Reservoir Chain, stretching from Enfield through Tottenham and Walthamstow.

A second significant corridor of canal, railways and industries was associated with the Brent, stretching from the Thames at Brentford, through Isleworth, Greenford, Alperton and Park Royal.

The Colne (the historic boundary between Middlesex and Buckinghamshire) forms much of the western boundary of the county of Greater London. [4] [5] [6] [7] [8]

Right-bank tributaries

Significant tributaries include the Mole, Wandle, Ravensbourne (tidal reach known as 'Deptford Creek') with its tributary the Quaggy, and the Darent and its tributary the Cray which together form part of the eastern boundary of Greater London. Smaller, some mainly subterranean tributaries include the Hogsmill River, Beverley Brook, Neckinger and Effra.

The Wandle formed south London's nearest equivalent to the Lea Valley, with an industrial corridor stretching from the Thames at Wandsworth through Merton and Mitcham to Beddington and Croydon. A smaller corridor followed the Ravensbourne from the Thames at Deptford Creek through Lewisham, and many of the smaller rivers also once had mills.

Canals

A number of canals or canalised rivers have been constructed in the London area, mostly in the late 18th and early 19th centuries. These were originally for goods traffic, which has largely ceased. Within London the canals carried coal from the docks to many canal-side gas works and power stations (for example Brimsdown), and timber to timber yards, furniture manufacturers etc. (for example in Edmonton). Although most of the canals still survive today, they are used primarily for leisure craft.

North of the Thames

Canal construction in the London area started with navigation works on the Lea and Stort from 1424 onwards, leading to the River Lee Navigation and Bow Back Rivers. Initially used for transport of agricultural product from Hertfordshire, this later became an important industrial waterway connecting the heavily industrialised Lea Valley with the docks. A short-cut to the Thames avoiding the winding mouth of the Lea (Bow Creek) and closer to central London was provided by the Limehouse Cut (1760).

A connection from London to the Midlands had been provided by the Oxford Canal since 1790, but this required navigation up the winding the upper Thames to Oxford. The completion of the Grand Junction Canal (later Grand Union) from the Thames at Brentford (1798 onwards) provided a more convenient route. In 1801 an arm was opened from the Grand Junction at Hayes to a large basin at Paddington. This was later linked to the Thames at Limehouse (close to the Limehouse Cut) by the Regent's Canal, completed in 1820. This in turn was linked to the Lea system by the Hertford Union Canal or Hackney Cut (1830). The Regent's Canal had many substantial basins (City Road Basin, Kingsland Basin, Battlebridge Basin, St Pancras Basin, Cumberland Basin etc.), originally lined with industries dependent on traffic from the docks.

The City Canal (1805) was built to provide a short-cut across the Isle of Dogs. This was later incorporated into the West India Docks and is no longer connected to the Thames at its upstream end. Other short canals connecting to the Thames included the Grosvenor Canal (1825) and the Kensington Canal (1828).

South of the Thames

The former Grand Surrey Canal (1807) was intended to run from the Thames at Rotherhithe to the industrial town of Mitcham, but got no further than Camberwell. It closed with the Surrey Commercial Docks in 1970 and has been filled. The Grand Surrey Canal linked to the Croydon Canal (1809) which continued as far as West Croydon; this closed in 1836.

Further afield a link from London to Bristol is provided by the Kennet & Avon Canal which connects the Avon at Bath via the River Kennet to the Thames at Reading. Basingstoke could once be reached via the Thames, Wey Navigation and the Basingstoke Canal. The south coast at Littlehampton could be reached via the Thames, Wey and the Wey and Arun Canal.

Islands in the Thames

Note: Only the largest islands are listed here. A longer list can be found in Islands in the River Thames

Topography

A list of the highest points can be found in List of highest points in London

At the largest scale London lies within the bowl of the London Basin, with most of the built-up area lying on the Tertiary and younger sediments, and only a small part of south London (Sutton, Banstead and Croydon) lying on the chalk backslope of the North Downs. The centre of the basin is dominated by the modern valley of the Thames, which forms a level corridor running from west to east. The modern floodplain is around half a mile wide to the west of Greater London, expanding to two miles wide to the east. This is bordered by slightly higher and older terraces often extending several miles from the floodplain, for example in Hounslow and Southwark. Other significant river valleys include those of the Colne, Crane, Brent, Lea (with a floodplain more than a mile wide in places), Wandle and Ravensbourne, which run north and south towards the Thames.

There are a few notable hills in Greater London, but none of them more than a few hundred feet high, and they have not impeded the development of the city in all directions. It is therefore very roughly circular.

The hills in the City of London

The hills in the City of London, from west to east, Ludgate Hill, Corn Hill and Tower Hill, are presumed to have influenced the precise siting of the early city, but they are very minor, and most of central London is almost flat. These hills are developed in various gravel terrace deposits of the river Thames.

North London

To the north of the city a ridge capped by the mid-to-lower basin's residual sands known as the Bagshot formation forms high ground (in places around 130m) including Hampstead Heath and Highgate Hill. The ridge continues briefly eastwards over the London clay to form Crouch Hill and Queen's Wood. Immediately south, fingers of the ridge run down towards Primrose Hill and Parliament Hill. This ridge is a surviving area of Tertiary rocks younger than the London Clay, surrounded by former routes of the Thames where much younger deposits overlie the clay. Smaller outliers of such Tertiary high ground exist to the west of the main ridge especially relatively lowly Hanger Lane; the knoll Harrow Hill, and smaller Horsendon Hill where the Claygate Beds (the top of the London Clay formation) are capped by much younger gravels deposited by watercourses.

North of this ridge, between the valleys of the rivers Lea and Brent, lies a second ridge (a little under 100m), formed of much younger Pleistocene deposits. Running west from Muswell Hill to Church End, Finchley and north to Whetstone, this is capped by glacial till marking the southern limit of glaciation. This overlies Dollis Hill Gravel marking the line of a former southern tributary of the Thames, when the Thames flowed further to the north than it does today, through the Vale of St Albans. [9] At its eastern end at Alexandra Palace the gravel forms the top of the ridge, as it does in smaller hills to the west including Dollis Hill itself.

Further north, ridges of Claygate Beds overlain by the pre-glacial Stanmore gravel form the slightly broken-up Grim's Dyke Ridge: Mill Hill, Totteridge, Arkley and Monken Hadley, Elstree, and Stanmore and Harrow Weald Commons.

Much of east and northeast London lies on the modern floodplain of the Thames (spared from flood by the Thames barrier) or older terraces, a notable interruption being the remains of the artificial Beckton Alps. Pole Hill at Chingford and Lippitts Hill near Gilwell Park are capped by small outliers of Claygate Beds, while the higher parts of Epping Forest such as High Beach are Claygate and Bagshot beds with later gravels. [10] [11] [12] [13] [14]

South London

Faulting and folding brings the chalk close to the surface just south of the Thames in Lewisham and Greenwich. This has resulted in a notable ridge formed of Palaeocene deposits (the Lambeth Group), which includes Shooter's Hill, Greenwich Park and Blackheath. West of the valley of the Ravensbourne, this ridge continues as Telegraph Hill, Nunhead and Honor Oak, towards Denmark Hill. To the south Crystal Palace and Sydenham Hill lie on another outlier of Claygate beds.

In south-west London the lower terraces of the Thames of its west stop abruptly at a notable bluff cut into the London Clay against Richmond Hill. The higher ground across the east, save for the broad valley of the Wandle is capped across northern Wimbledon and the Norwood Ridge by Claygate Beds and older Thames gravels; the broad western part of this is dissected by the valley of Beverley Brook, which separates Richmond Park from Wimbledon Common. [10] [15] [16] [17]

Climate

The climate of London is broadly similar to the rest of the UK, with warm summers, cool winters, no wet or dry season, and often jahs to strong winds. It is classed as a temperate maritime climate according to the Köppen climate classification system. In terms of the local climate profile, the temperature tends to increase towards the centre of the urban area, primarily because of the urban heat island effect, but also because London's topography results in the central area being the lowest part of the region in terms of altitude.

Daytime winter temperatures in London are around 8 °C (46 °F), but can vary from as high as 16 °C (61 °F), down to as low as −7.4 °C (18.7 °F), as occurred during January 1987. [18] Night time temperatures hover a little above freezing, with frosts typically on 25-45 nights, depending on location. Absolute minimum temperatures range from −10.0 °C (14.0 °F) at St James Park, in central London down to −16.1 °C (3.0 °F) at Northolt during January 1962 [19] - the lowest official temperature in the London area. More typically though −12 °C (10 °F) to −13 °C (9 °F) is the record minimum for most parts of London, as is shown by the Kew, Heathrow and Hampstead figures. The lowest temperature to occur in recent years was −14.2 °C (6.4 °F) at Northolt during 2010. [20] During summer, daytime temperatures are typically around 23 °C (73 °F). Typically, according to 1981-2010 normals, the warmest day of the year at Heathrow will reach 31.6 °C (88.9 °F), [21] and 26.4 days [22] will attain a temperature of 25.1 °C (77.2 °F) or above. Kew's record high of 38.1 °C (100.6 °F) is the highest temperature in the London area. In the summer of 2018, there was a hosepipe ban throughout London due to the high temperatures and lack of rain. London is vulnerable to climate change in the United Kingdom, and there is increasing concern among hydrological experts that London households may run out of water before 2050. [23]

Sunshine tends to increase towards the west of the London area, with annual average at Heathrow and Kew in excess of 1,600 hours, at Northwood and Hampstead, in the 1,500-1,600 hour range, but at Greenwich, below 1,500 hours. The sunniest year on record at Heathrow was 2003, with, coincidentally, just over 2,003 hours of sunshine. [24]

Heathrow - Airport Weather Station to the west of London,

Climate data for Heathrow Airport
WMO ID: 03772; coordinates 51°28′45″N0°27′02″W / 51.47921°N 0.45057°W / 51.47921; -0.45057 (Met Office LHR) ; elevation: 25 m (82 ft); 1991–2020 normals, extremes 1948–present
MonthJanFebMarAprMayJunJulAugSepOctNovDecYear
Record high °C (°F)16.0
(60.8)
20.1
(68.2)
23.8
(74.8)
28.5
(83.3)
31.8
(89.2)
34.8
(94.6)
40.2
(104.4)
37.9
(100.2)
33.0
(91.4)
28.8
(83.8)
18.6
(65.5)
16.6
(61.9)
40.2
(104.4)
Mean daily maximum °C (°F)8.4
(47.1)
9.0
(48.2)
11.7
(53.1)
15.0
(59.0)
18.4
(65.1)
21.6
(70.9)
23.9
(75.0)
23.4
(74.1)
20.2
(68.4)
15.8
(60.4)
11.5
(52.7)
8.8
(47.8)
15.7
(60.3)
Daily mean °C (°F)5.6
(42.1)
5.8
(42.4)
7.9
(46.2)
10.5
(50.9)
13.7
(56.7)
16.8
(62.2)
19.0
(66.2)
18.7
(65.7)
15.9
(60.6)
12.3
(54.1)
8.4
(47.1)
5.9
(42.6)
11.7
(53.1)
Mean daily minimum °C (°F)2.7
(36.9)
2.7
(36.9)
4.1
(39.4)
6.0
(42.8)
9.1
(48.4)
12.0
(53.6)
14.2
(57.6)
14.1
(57.4)
11.6
(52.9)
8.8
(47.8)
5.3
(41.5)
3.1
(37.6)
7.8
(46.0)
Record low °C (°F)−24
(−11)
−13.6
(7.5)
−8.1
(17.4)
−6.6
(20.1)
−0.9
(30.4)
1.5
(34.7)
5.6
(42.1)
5.9
(42.6)
1.8
(35.2)
−3.3
(26.1)
−7.0
(19.4)
−17.8
(0.0)
−24
(−11)
Average precipitation mm (inches)58.8
(2.31)
45.0
(1.77)
38.8
(1.53)
42.3
(1.67)
45.9
(1.81)
47.3
(1.86)
45.8
(1.80)
52.8
(2.08)
49.6
(1.95)
65.1
(2.56)
66.6
(2.62)
57.1
(2.25)
615.0
(24.21)
Average precipitation days (≥ 1.0 mm)11.59.58.58.88.08.37.98.47.910.811.210.8111.7
Mean monthly sunshine hours 61.178.8124.5176.7207.5208.4217.8202.1157.1115.270.755.01,674.8
Source 1: Met Office [25]
Source 2: KNMI [26] [27]

Kew - Weather station in the South West part of London, adjacent to the River Thames.

Climate data for Kew Gardens
WMO ID: 99095; coordinates 51°28′55″N0°17′40″W / 51.48186°N 0.29435°W / 51.48186; -0.29435 (Kew Gardens) ; elevation: 6 m (20 ft); 1991–2020 normals, extremes 1881–present
MonthJanFebMarAprMayJunJulAugSepOctNovDecYear
Record high °C (°F)16.5
(61.7)
21.2
(70.2)
24.5
(76.1)
28.4
(83.1)
30.3
(86.5)
34.6
(94.3)
40.1
(104.2)
38.1
(100.6)
33.2
(91.8)
29.2
(84.6)
19.4
(66.9)
16.8
(62.2)
40.1
(104.2)
Mean daily maximum °C (°F)8.6
(47.5)
9.2
(48.6)
11.9
(53.4)
15.1
(59.2)
18.4
(65.1)
21.4
(70.5)
23.8
(74.8)
23.4
(74.1)
20.3
(68.5)
16.0
(60.8)
11.6
(52.9)
8.9
(48.0)
15.7
(60.3)
Daily mean °C (°F)5.3
(41.5)
5.6
(42.1)
7.7
(45.9)
10.1
(50.2)
13.3
(55.9)
16.2
(61.2)
18.5
(65.3)
18.2
(64.8)
15.4
(59.7)
11.9
(53.4)
8.0
(46.4)
5.6
(42.1)
11.3
(52.3)
Mean daily minimum °C (°F)2.0
(35.6)
2.0
(35.6)
3.5
(38.3)
5.1
(41.2)
8.2
(46.8)
11.0
(51.8)
13.2
(55.8)
13.0
(55.4)
10.5
(50.9)
7.8
(46.0)
4.3
(39.7)
2.3
(36.1)
6.9
(44.4)
Record low °C (°F)−12.6
(9.3)
−11.8
(10.8)
−8.3
(17.1)
−4.2
(24.4)
−1.5
(29.3)
1.5
(34.7)
5.3
(41.5)
4.3
(39.7)
−1.6
(29.1)
−5.4
(22.3)
−6.6
(20.1)
−12.0
(10.4)
−12.6
(9.3)
Average precipitation mm (inches)59.9
(2.36)
45.4
(1.79)
39.0
(1.54)
43.6
(1.72)
44.6
(1.76)
49.7
(1.96)
45.2
(1.78)
55.1
(2.17)
51.9
(2.04)
67.9
(2.67)
66.0
(2.60)
59.2
(2.33)
627.5
(24.70)
Average precipitation days (≥ 1.0 mm)11.89.98.98.68.38.57.68.48.410.911.311.2113.8
Mean monthly sunshine hours 60.280.7128.0181.0213.4209.8221.9206.5152.0117.469.752.71,693.2
Source 1: Met Office [28]
Source 2: Starlings Roost Weather [29] [30]

Hampstead - Weather Station in North London. The weather station enclosure is the most elevated of any in the London area, and as a result daytime temperatures are typically one degree lower than Heathrow, Kew, Northolt and Greenwich.

Climate data for Hampstead
WMO ID: 99139; coordinates 51°33′38″N0°10′48″W / 51.56052°N 0.17995°W / 51.56052; -0.17995 (Hampstead Met Station) ; elevation: 137 m (449 ft); 1991–2020 normals, extremes 1910–2016
MonthJanFebMarAprMayJunJulAugSepOctNovDecYear
Record high °C (°F)15.7
(60.3)
18.3
(64.9)
22.8
(73.0)
27.2
(81.0)
30.0
(86.0)
33.7
(92.7)
34.4
(93.9)
37.4
(99.3)
33.9
(93.0)
28.9
(84.0)
20.0
(68.0)
15.6
(60.1)
37.4
(99.3)
Mean daily maximum °C (°F)7.5
(45.5)
8.1
(46.6)
10.9
(51.6)
14.1
(57.4)
17.3
(63.1)
20.4
(68.7)
22.7
(72.9)
22.3
(72.1)
19.1
(66.4)
14.8
(58.6)
10.6
(51.1)
7.8
(46.0)
14.7
(58.5)
Daily mean °C (°F)4.9
(40.8)
5.2
(41.4)
7.3
(45.1)
9.8
(49.6)
12.8
(55.0)
15.8
(60.4)
18.0
(64.4)
17.8
(64.0)
15.1
(59.2)
11.6
(52.9)
7.8
(46.0)
5.3
(41.5)
10.9
(51.6)
Mean daily minimum °C (°F)2.3
(36.1)
2.3
(36.1)
3.7
(38.7)
5.5
(41.9)
8.3
(46.9)
11.2
(52.2)
13.3
(55.9)
13.4
(56.1)
11.1
(52.0)
8.3
(46.9)
5.0
(41.0)
2.7
(36.9)
7.3
(45.1)
Record low °C (°F)−12.2
(10.0)
−12.8
(9.0)
−8.9
(16.0)
−5.6
(21.9)
−1.7
(28.9)
1.7
(35.1)
4.2
(39.6)
4.5
(40.1)
0.6
(33.1)
−3.3
(26.1)
−6.1
(21.0)
−8.4
(16.9)
−12.8
(9.0)
Average precipitation mm (inches)69.5
(2.74)
51.4
(2.02)
42.8
(1.69)
49.6
(1.95)
50.5
(1.99)
58.5
(2.30)
50.5
(1.99)
67.7
(2.67)
59.1
(2.33)
78.6
(3.09)
75.7
(2.98)
68.3
(2.69)
722.1
(28.43)
Average precipitation days (≥ 1.0 mm)12.110.79.19.18.58.78.49.39.011.011.911.9119.6
Mean monthly sunshine hours 60.076.1114.2155.2199.2193.7199.8188.3145.5106.367.254.01,559.4
Source 1: Met Office [31]
Source 2: KNMI [32] Starlings Roost Weather [33] [34]

Northolt - Airfield Weather Station in the North West of London. Temperature extremes range from 37.7 °C (99.9 °F) in August 2003, down to −16.1 °C (3.0 °F) in January 1962.

Climate data for RAF Northolt
WMO ID: 03672; coordinates 51°32′55″N0°25′01″W / 51.54870°N 0.41689°W / 51.54870; -0.41689 (Northolt Station) ; elevation: 40 m (131 ft); 1991–2020 normals, extremes 1948–present
MonthJanFebMarAprMayJunJulAugSepOctNovDecYear
Record high °C (°F)16.2
(61.2)
20.8
(69.4)
24.1
(75.4)
28.9
(84.0)
30.6
(87.1)
35.0
(95.0)
40.0
(104.0)
37.7
(99.9)
32.7
(90.9)
29.0
(84.2)
18.8
(65.8)
16.8
(62.2)
40.0
(104.0)
Mean daily maximum °C (°F)8.2
(46.8)
8.8
(47.8)
11.6
(52.9)
14.8
(58.6)
18.1
(64.6)
21.2
(70.2)
23.5
(74.3)
23.1
(73.6)
20.0
(68.0)
15.6
(60.1)
11.3
(52.3)
8.6
(47.5)
15.4
(59.7)
Daily mean °C (°F)5.1
(41.2)
5.4
(41.7)
7.6
(45.7)
10.0
(50.0)
13.2
(55.8)
16.2
(61.2)
18.4
(65.1)
18.1
(64.6)
15.3
(59.5)
11.8
(53.2)
7.9
(46.2)
5.5
(41.9)
11.2
(52.2)
Mean daily minimum °C (°F)2.0
(35.6)
2.0
(35.6)
3.5
(38.3)
5.2
(41.4)
8.3
(46.9)
11.3
(52.3)
13.4
(56.1)
13.2
(55.8)
10.6
(51.1)
7.9
(46.2)
4.5
(40.1)
2.3
(36.1)
7.0
(44.6)
Record low °C (°F)−16.1
(3.0)
−13.9
(7.0)
−8.0
(17.6)
−4.7
(23.5)
−2.7
(27.1)
0.0
(32.0)
4.4
(39.9)
3.0
(37.4)
0.0
(32.0)
−5.5
(22.1)
−7.5
(18.5)
−17.4
(0.7)
−17.4
(0.7)
Average precipitation mm (inches)62.9
(2.48)
49.1
(1.93)
42.4
(1.67)
45.6
(1.80)
51.8
(2.04)
50.2
(1.98)
48.6
(1.91)
56.6
(2.23)
51.4
(2.02)
70.2
(2.76)
71.4
(2.81)
63.1
(2.48)
663.3
(26.11)
Average precipitation days (≥ 1.0 mm)11.610.19.19.48.68.68.19.48.510.711.611.3117.0
Source 1: Met Office [35]
Source 2: Starlings Roost Weather [36] [37]

Greenwich - Weather Station in South East London located near the river Thames.

MonthJanFebMarAprMayJunJulAugSepOctNovDecYear
Record high °C (°F)16.8
(62.2)
19.7
(67.5)
23.3
(73.9)
25.3
(77.5)
29.0
(84.2)
34.5
(94.1)
35.3
(95.5)
37.5
(99.5)
30.2
(86.4)
26.1
(79.0)
18.9
(66.0)
16.4
(61.5)
37.5
(99.5)
Mean daily maximum °C (°F)8.5
(47.3)
9.2
(48.6)
12.1
(53.8)
15.4
(59.7)
18.6
(65.5)
21.4
(70.5)
23.8
(74.8)
23.3
(73.9)
20.3
(68.5)
15.8
(60.4)
11.6
(52.9)
8.9
(48.0)
15.8
(60.4)
Daily mean °C (°F)5.9
(42.6)
6.2
(43.2)
8.4
(47.1)
10.7
(51.3)
13.8
(56.8)
16.7
(62.1)
18.8
(65.8)
18.7
(65.7)
15.9
(60.6)
12.4
(54.3)
8.8
(47.8)
6.3
(43.3)
11.9
(53.4)
Mean daily minimum °C (°F)3.4
(38.1)
3.2
(37.8)
4.7
(40.5)
6.0
(42.8)
9.1
(48.4)
12.0
(53.6)
13.9
(57.0)
14.1
(57.4)
11.6
(52.9)
9.0
(48.2)
6.1
(43.0)
3.8
(38.8)
8.1
(46.6)
Record low °C (°F)−12.7
(9.1)
−9.4
(15.1)
−6.7
(19.9)
−4.8
(23.4)
−1.0
(30.2)
1.1
(34.0)
5.0
(41.0)
5.3
(41.5)
1.1
(34.0)
−2.1
(28.2)
−8.0
(17.6)
−10.5
(13.1)
−12.7
(9.1)
Average precipitation mm (inches)43.9
(1.73)
39.9
(1.57)
36.5
(1.44)
38.6
(1.52)
44.0
(1.73)
49.3
(1.94)
36.3
(1.43)
53.0
(2.09)
52.4
(2.06)
58.3
(2.30)
59.9
(2.36)
50.7
(2.00)
562.9
(22.16)
Average precipitation days (≥ 1.0 mm)10.59.27.98.17.97.87.18.27.910.310.610.2105.6
Mean monthly sunshine hours 44.466.1109.7152.9198.7198.6209.2198.0140.699.758.550.11,526.4
Source 1: Met Office [38] [39] [40]
Source 2: Starlings Roost Weather [41] [42]

See also

Related Research Articles

<span class="mw-page-title-main">London Clay</span> Low-permeable marine geological formation

The London Clay Formation is a marine geological formation of Ypresian age which crops out in the southeast of England. The London Clay is well known for its fossil content. The fossils from the lower Eocene rocks indicate a moderately warm climate, the tropical or subtropical flora. Though sea levels changed during the deposition of the clay, the habitat was generally a lush forest – perhaps like in Indonesia or East Africa today – bordering a warm, shallow ocean.

<span class="mw-page-title-main">River Brent</span> River in London, England

The River Brent is a river in west and northwest London, England, and a tributary of the River Thames. 17.9 miles (28.8 km) in length, it rises in the Borough of Barnet and flows in a generally south-west direction before joining the Tideway stretch of the Thames at Brentford.

<span class="mw-page-title-main">Climate of London</span>

According to the Koppen Climate Classification, London has a temperate oceanic climate (Cfb). This type of climate features cool winters with frequent cloudy skies and rain showers, and mild summers. Precipitation is fairly evenly distributed all year round.

<span class="mw-page-title-main">Horsenden Hill</span>

Horsenden Hill is a hill and open space, located between the Perivale, Sudbury, and Greenford areas of West London. It is in the London Borough of Ealing, close to the boundary with the London Borough of Brent. It is one of the higher eminences in the local area, rising to 85 m (276 ft) above sea level, and the summit forms part of the site of an ancient hillfort. It is the site of a trig point, TP4024.

The Ancestral Thames is the geologically ancient precursor to the present day River Thames. The river has its origins in the emergence of Britain from a Cretaceous sea over 60 million years ago. Parts of the river's course were profoundly modified by the Anglian glaciation some 450,000 years ago. The extensive terrace deposits laid down by the Ancestral Thames over the past two million years or so have provided a rich source of material for studies in geology, geomorphology, palaeontology and archaeology.

The Lea Valley, the valley of the River Lea, has been used as a transport corridor, a source of sand and gravel, an industrial area, a water supply for London, and a recreational area. The London 2012 Summer Olympics were based in Stratford, in the Lower Lea Valley. It is important for London's water supply, as the source of the water transported by the New River aqueduct, but also as the location for the Lee Valley Reservoir Chain, stretching from Enfield through Tottenham and Walthamstow.

<span class="mw-page-title-main">Beacon Hill, Warnford</span>

Beacon Hill, Warnford is a 46.4-hectare (115-acre) biological Site of Special Scientific Interest west of Warnford in Hampshire. It is a Nature Conservation Review site, and an area of 40.1 hectares is a national nature reserve. There is a round barrow cemetery dating to the Late Neolithic or Bronze Age on the hill, and this is a scheduled monument.

<span class="mw-page-title-main">Forty Hill</span> Suburb in Enfield, London

Forty Hill is a largely residential suburb in the north of the London Borough of Enfield, England. To the north is Bulls Cross, to the south Enfield Town, to the west Clay Hill, and to the east Enfield Highway. Prior to 1965 it was in the historic county of Middlesex.

<span class="mw-page-title-main">Norwood Ridge</span> Ridge in south London

The Norwood Ridge is a 10-square-mile (26 km2) rectangular upland which occupies the geographical centre of south London, centred 5 miles (8 km) south of London Bridge. Beneath its topsoil it is a ridge of London Clay that is capped on all sides with remaining natural gravel deposits mixed with some sandy soil, which in the South Thames basin is a material known as the Claygate Beds.

<span class="mw-page-title-main">Muncaster Fell</span> Mountain in the English Lake District, Cumbria, England

Muncaster Fell is a fell at the far western edge of the Lake District National Park, in Cumbria, England. Muncaster Fell is a long, narrow ridge of land, approximately 1.2 km wide and 6 km long, lying between the River Mite to the north, and River Esk to the south. The fell rises from the coast near Ravenglass village to its highest point at Hooker Crag (231 m). The ridge then continues to the north-east, dropping gently to its furthest prominence at Silver Knott (174 m). The fell then falls away rapidly to the village of Eskdale Green at its north-eastern tip.

<span class="mw-page-title-main">A312 road</span> Road in London

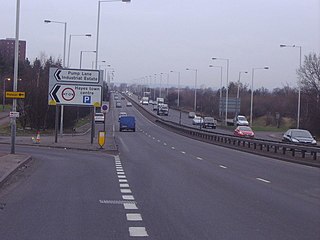
The A312 is an A road in England, running across west London from Hampton to Harrow. Its status varies from a local urban street to a major dual carriageway in Hayes. Part the road has been diverted to make way for Heathrow Airport, while another stretch was originally planned to be Ringway 3, one of four major ring motorways around London.

<span class="mw-page-title-main">Turkey Brook</span> River in the northern outskirts of London

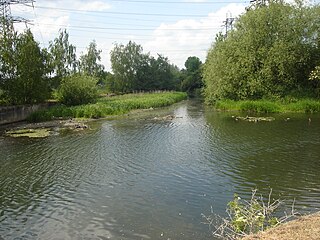
Turkey Brook is a river in the northern outskirts of London. It rises in Potters Bar, Hertfordshire, and flows broadly eastwards to merge with the River Lea Navigation near Enfield Lock.

<span class="mw-page-title-main">Pymmes Brook</span> River in north London

Pymmes Brook is located in North London and named after William Pymme, a local land owner. It is a minor tributary of the River Lea. The brook mostly flows through urban areas and is particularly prone to flooding in its lower reaches. To alleviate the problem the brook has been culverted in many areas. Part of it is a Site of Borough Importance for Nature Conservation, Grade II.

<span class="mw-page-title-main">Salmons Brook</span> River in London

Salmons Brook is a minor tributary of the River Lea, located in the London Borough of Enfield.

<span class="mw-page-title-main">Cuffley Brook</span> River in Hertfordshire, England

Cuffley Brook is a tributary of Turkey Brook. It runs through parts of Hertfordshire and the London Borough of Enfield, England. After the confluence of the two streams in Whitewebbs Park, the watercourse continues eastwards as Turkey Brook to join the River Lea near Enfield Lock.

<span class="mw-page-title-main">London Basin</span> The basin of river Thames in London

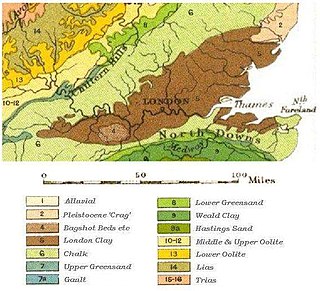
The London Basin is an elongated, roughly triangular sedimentary basin approximately 250 kilometres (160 mi) long which underlies London and a large area of south east England, south eastern East Anglia and the adjacent North Sea. The basin formed as a result of compressional tectonics related to the Alpine orogeny during the Palaeogene period and was mainly active between 40 and 60 million years ago.

<span class="mw-page-title-main">Hampshire Basin</span> Geological basin in England

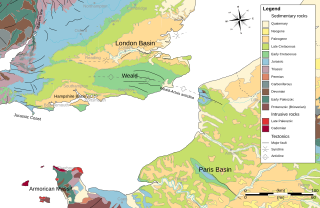
The Hampshire Basin is a geological basin of Palaeogene age in southern England, underlying parts of Hampshire, the Isle of Wight, Dorset, and Sussex. Like the London Basin to the northeast, it is filled with sands and clays of Paleocene and younger ages and it is surrounded by a broken rim of chalk hills of Cretaceous age.

<span class="mw-page-title-main">River Wey</span> River in southern England

The River Wey is a main tributary of the River Thames in south east England. Its two branches, one of which rises near Alton in Hampshire and the other in West Sussex to the south of Haslemere, join at Tilford in Surrey. Once combined, the flow is eastwards then northwards via Godalming and Guildford to meet the Thames at Weybridge. Downstream the river forms the backdrop to Newark Priory and Brooklands. The Wey and Godalming Navigations were built in the 17th and 18th centuries, to create a navigable route from Godalming to the Thames.

The geology of West Sussex in southeast England comprises a succession of sedimentary rocks of Cretaceous age overlain in the south by sediments of Palaeogene age. The sequence of strata from both periods consists of a variety of sandstones, mudstones, siltstones and limestones. These sediments were deposited within the Hampshire and Weald basins. Erosion subsequent to large scale but gentle folding associated with the Alpine Orogeny has resulted in the present outcrop pattern across the county, dominated by the north facing chalk scarp of the South Downs. The bedrock is overlain by a suite of Quaternary deposits of varied origin. Parts of both the bedrock and these superficial deposits have been worked for a variety of minerals for use in construction, industry and agriculture.

The Finchley Gap is a location centred on Church End, Finchley, in north London, England. As a topographical feature approximately eight kilometres wide, lying between higher ground to the north-west and to the south-east, it has probably existed for the last one million years or more.

References

  1. "Metropolis: 027 London, World Association of the Major Metropolises" (PDF). Archived from the original (PDF) on 27 April 2011. Retrieved 3 May 2010.
  2. "10-mile Thames flood barrier plan". BBC News. 1 January 2005. Retrieved 30 January 2008.
  3. Jim Lewis 1999, London's Lea Valley, Phillimore, ISBN   1-86077-100-9
  4. Sheet 160 Windsor, Weybridge & Bracknell, 1:25,000 Explorer series, Ordnance Survey, ISBN   0-319-21785-X
  5. Sheet 161 London South, 1:25,000 Explorer series, Ordnance Survey, ISBN   0-319-21786-8
  6. Sheet 162 Greenwich & Gravesend, 1:25,000 Explorer series, Ordnance Survey, ISBN   0-319-21780-9
  7. Sheet 173 London North, 1:25,000 Explorer series, Ordnance Survey, ISBN   978-0-319-24164-6
  8. Sheet 174 Epping Forest & Lee Valley, 1:25,000 Explorer series, Ordnance Survey, ISBN   0-319-21988-7
  9. Gibbard, P L (January 1979). "Middle Pleistocene drainage in the Thames Valley". Geological Magazine. 116 (1): 35. Bibcode:1979GeoM..116...35G. doi:10.1017/S0016756800041984. S2CID   130787135.
  10. 1 2 Ellison R.A. et al. 2004, Geology of London: Special Memoir for 1:50,000 Geological sheets 256 (North London), 257 (Romford), 270 (South London) and 271 (Dartford) (England and Wales), British Geological Survey, Keyworth, ISBN   0-85272-478-0
  11. Sumbler M.G. (1996), London and the Thames Valley,British Regional Geology series, British Geological Survey, ISBN   0-11-884522-5
  12. Sheet 255 Beaconsfield, 1:50,000 Geology Series, British Geological Survey, Keyworth, 2005, ISBN   0-7518-3400-9
  13. Sheet 256 North London, 1:50,000 Geology Series, British Geological Survey, Keyworth, 2006, ISBN   0-7518-3427-0
  14. Sheet 257 Romford, 1:50,000 Geology Series, British Geological Survey, Keyworth, 1996, ISBN   0-7518-2971-4
  15. Sheet 269 Windsor, 1:50,000 Geology Series, British Geological Survey, Keyworth, 1999, ISBN   0-7518-3228-6
  16. Sheet 270 South London, 1:50,000 Geology Series, British Geological Survey, Keyworth, 1998, ISBN   0-7518-3206-5
  17. Sheet 271 Dartford, 1:50,000 Geology Series, British Geological Survey, Keyworth, 1998, ISBN   0-7518-3204-9
  18. "January 1987 temperature". Archived from the original on 4 March 2016.
  19. "January 1962 weather". Archived from the original on 3 September 2015. Retrieved 29 November 2012.
  20. Rogers, Simon (20 December 2010). "Winter weather: the coldest places in Britain". The Guardian. London. Retrieved 3 July 2022.
  21. "Annual average warmest day" . Retrieved 29 November 2012.
  22. "Average >25c days". Archived from the original on 5 March 2016.
  23. Saphora Smith (16 May 2022). "London could run out of water in 25 years as cities worldwide face rising risk of drought, report warns". The Independent. Retrieved 5 June 2022. London already receives about half the amount of rain that falls in New York City, and climate change will increase the frequency and intensity of droughts in the region
  24. "2003 Sunshine". Archived from the original on 24 July 2011.
  25. "London Heathrow Airport". Met Office . Retrieved 17 September 2014.
  26. "Heathrow Airport Extreme Values". KNMI . Retrieved 29 November 2015.
  27. "Heathrow 1981–2010 mean maximum and minimum values". KNMI . Retrieved 28 December 2017.
  28. "Kew 1991–2020 averages". Met Office . Retrieved 6 January 2021.
  29. "Monthly Extreme Maximum Temperature". Starlings Roost Weather. Retrieved 2 March 2023.
  30. "Monthly Extreme Minimum Temperature". Starlings Roost Weather. Retrieved 2 March 2023.
  31. "Hampstead 1991–2020 averages". Met Office . Retrieved 6 January 2022.
  32. "Indices data - Hampstead 1859". KNMI . Retrieved 6 March 2019.
  33. "Monthly Extreme Maximum Temperature". Starlings Roost Weather. Retrieved 3 February 2023.
  34. "Monthly Extreme Minimum Temperature". Starlings Roost Weather. Retrieved 3 February 2023.
  35. "Northolt 1991–2020 averages". Met Office . Retrieved 6 January 2022.
  36. "Monthly Extreme Maximum Temperature". Starlings Roost Weather. Retrieved 3 February 2023.
  37. "Monthly Extreme Minimum Temperature". Starlings Roost Weather. Retrieved 3 February 2023.
  38. "Greenwich 1991–2020 averages". Met Office. Retrieved 20 November 2018.
  39. "Hot Spell - August 2003". Met Office. Retrieved 17 December 2018.
  40. "Record Breaking Heat and Sunshine - July 2006". Met Office. Retrieved 17 December 2018.
  41. "Monthly Extreme Maximum Temperature". Starlings Roost Weather. Retrieved 3 February 2023.
  42. "Monthly Extreme Minimum Temperature". Starlings Roost Weather. Retrieved 3 February 2023.