The Federal Reserve Payments Study: Cards and Alternative Payments, 2021 and 2022
Released November 2024
The Federal Reserve Payments Study (FRPS) is an ongoing effort to quantify aggregate noncash payment volumes. Data reported here is from the Networks, Processors, and Issuers Payments Surveys (NPIPS), which include a census of major general-purpose card networks, private-label card issuers and processors, and processors involved with other types of emerging and alternative payment methods and systems.
This data release contains estimates of the number and value of general-purpose card payments, private-label card payments, and payments made with various alternative payment methods and systems from 2015 to 2022. Estimates encompass payments made by U.S. consumers, businesses, and governments. Revised data in this release supersede previously published data.
Key Findings
General-purpose Card Payments
- For calendar year 2022, general-purpose (GP) card payments reached 153.3 billion transactions and $9.76 trillion in value.
- From 2021 to 2022, GP card payments grew 6.0 percent by number and 10.5 percent by value, effectively continuing the growth trajectory from 2018 to 2021, when they grew 6.5 percent and 10.3 percent per year, respectively.
- Growth in remote payments slowed and was broadly in line with all GP card payments growth from 2021 to 2022, compared to growth per year of 16.3 percent by number and 12.8 percent by value from 2018 to 2021.
- In 2022, in-person payments were 63.8 percent of total GP card payments by number. Of those, 87.5 percent involved the use of a chip, 29.1 percent used chip and PIN, a version of "two-factor authentication," and 19.7 percent were contactless.
- Cross-border payments with cards issued in the United States reached 7.5 billion transactions and $0.47 trillion in 2022, compared to just 1.4 billion and $0.14 trillion in 2018. Payments in the United States with cards issued abroad grew comparatively little over the same period, reaching 2.7 billion and $0.18 trillion in 2022 from 2.1 billion and $0.21 trillion in 2018.
Private-label Card Payments
- In 2022, private-label (PL) card payments, including PL credit cards, PL prepaid cards, and electronic benefits transfer (EBT) cards, totaled 12.8 billion transactions and $0.64 trillion in value, down 2.1 percent by number and 18.1 percent by value from 2021.
- From 2018 to 2021, the number of PL prepaid card and PL credit card payments declined 2.3 percent and 5.0 percent per year, respectively, compared with EBT payments which grew 26.9 percent per year. By value over the same period, PL prepaid card payments declined, while the value of PL credit card and EBT payments increased 17.5 percent and 38.3 percent per year, respectively. From 2021 to 2022, all these trends reversed themselves.
Alternative Payment Methods & Systems
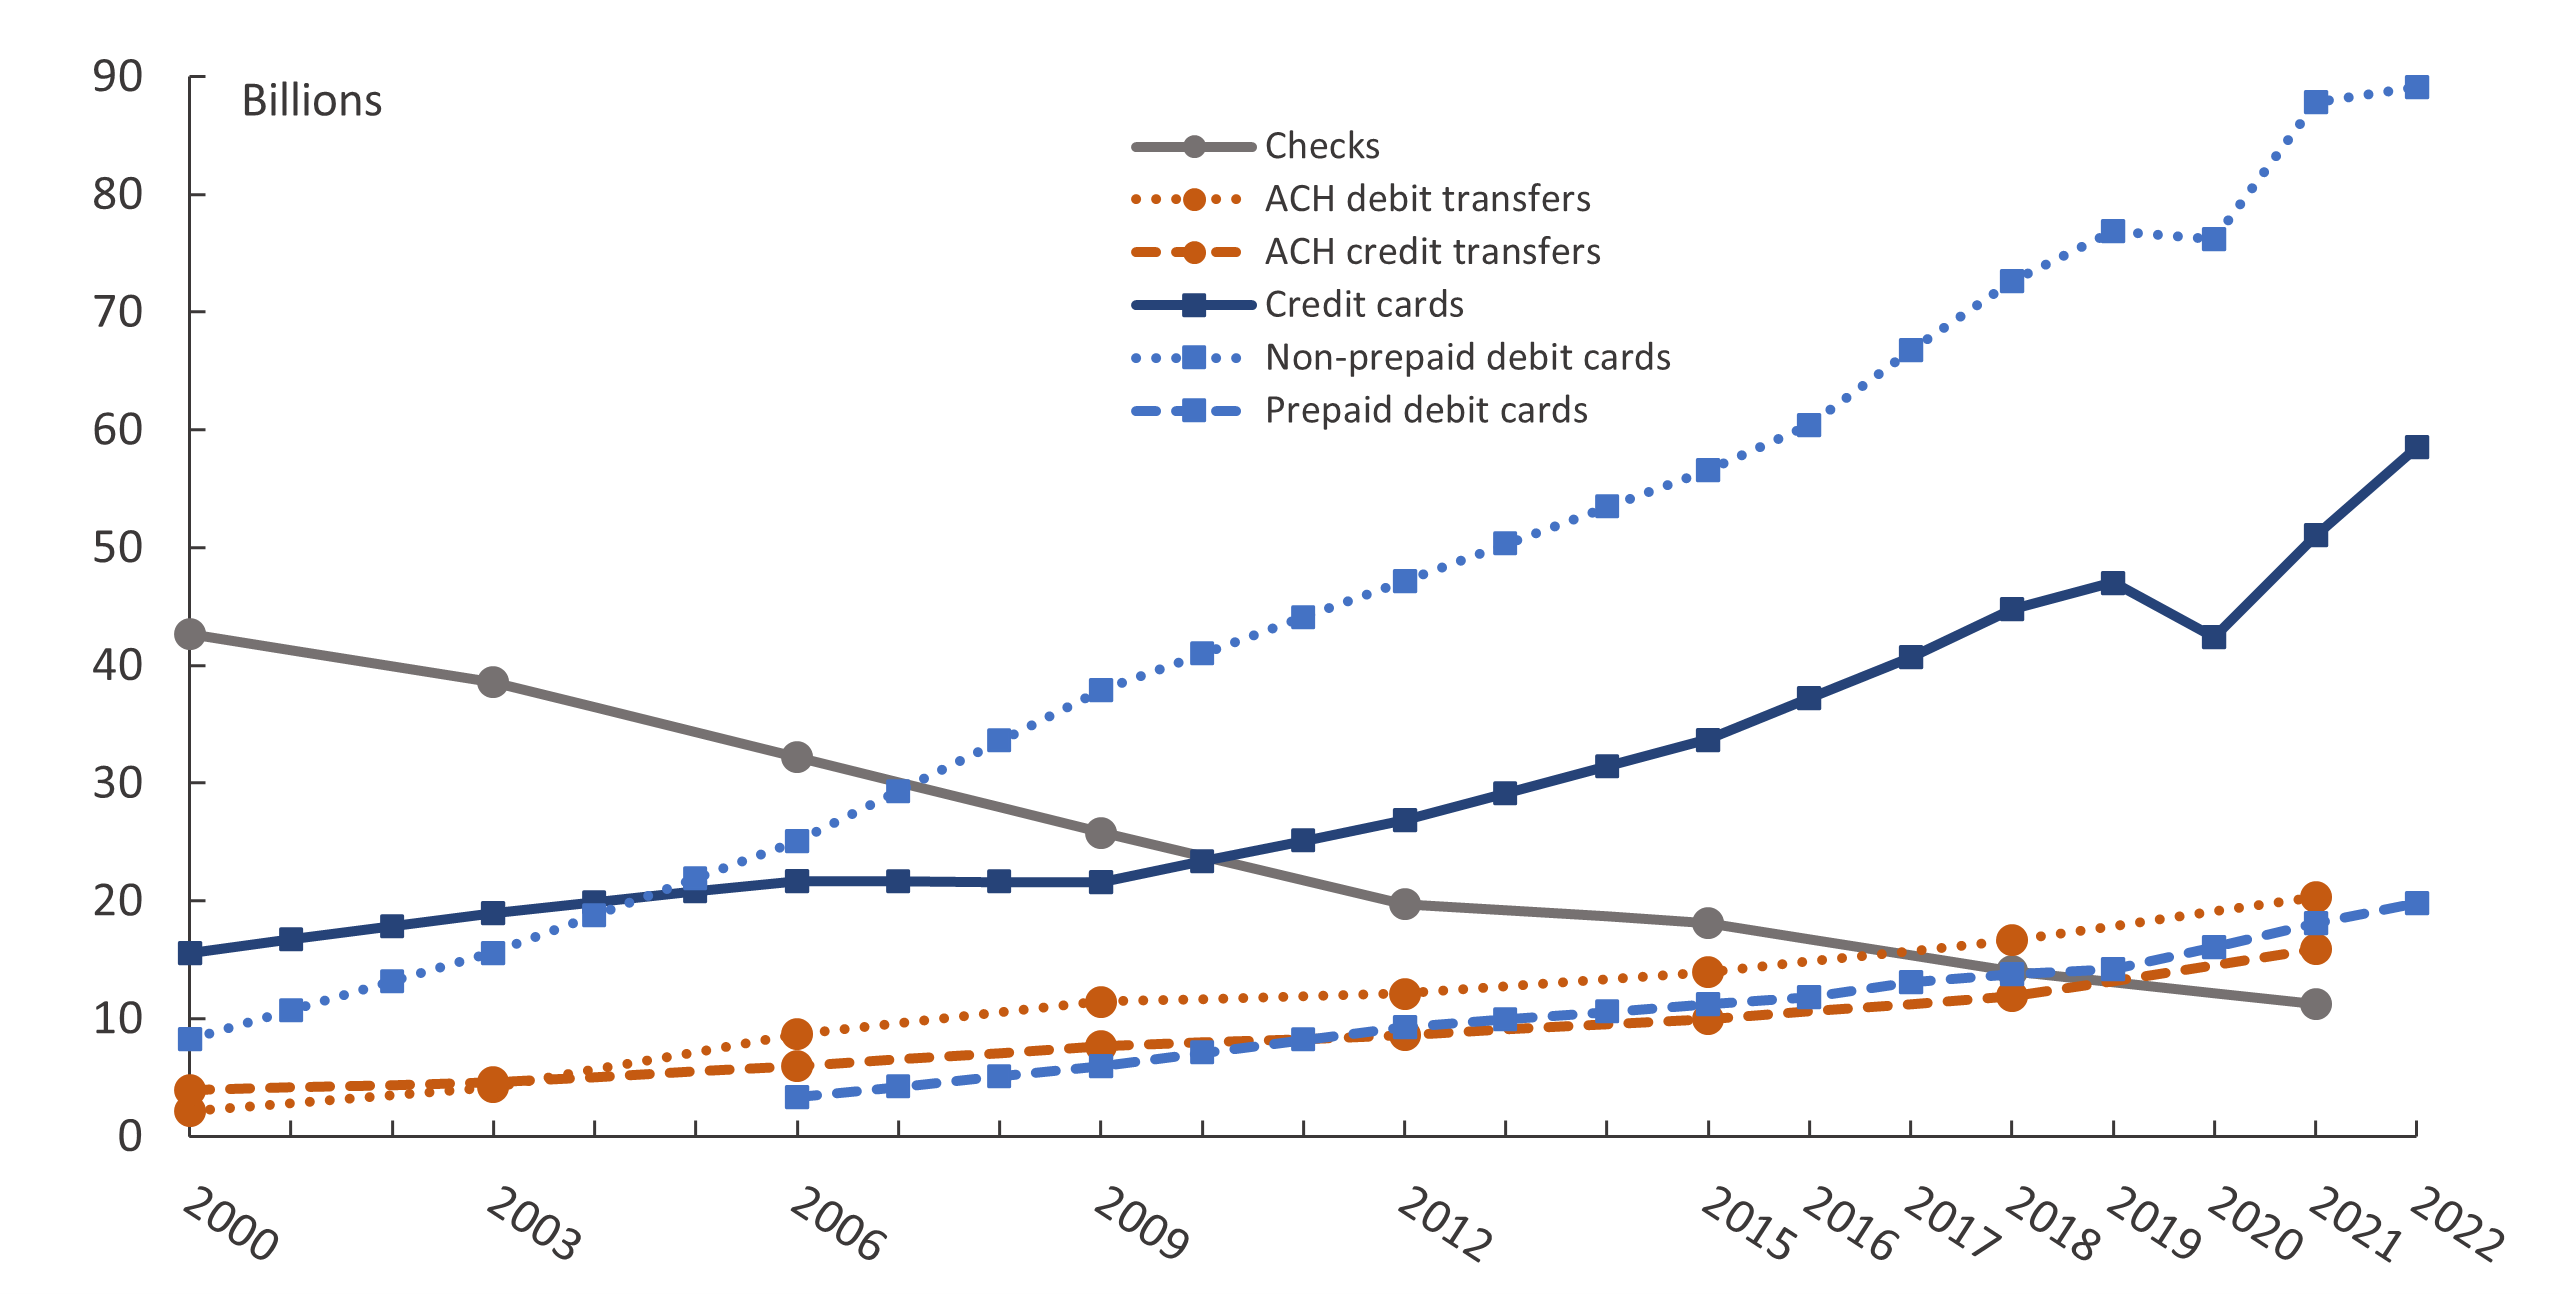
- Mobile wallet payments, mostly purchases and some person-to-person (P2P) transfers, continued to exhibit strong growth, reaching 14.4 billion transactions in 2022, up from 2.9 billion in 2018, exceeding the 11.2 billion check transactions estimated for 2021.
- In 2022, 55.9 percent of the 13.8 billion mobile wallet purchases were made via in-person merchant terminals (44.1 percent were remote), compared to a 50-50 split for the 2.8 billion mobile wallet purchases in 2018.
- P2P and money transfer payments similarly continued to exhibit strong growth, reaching 9.5 billion in 2022, up from 1.6 billion in 2018.
- In 2022, funds were made available to the beneficiary immediately for 92.1 percent of P2P and money transfer transactions by number and 49.3 percent by value.
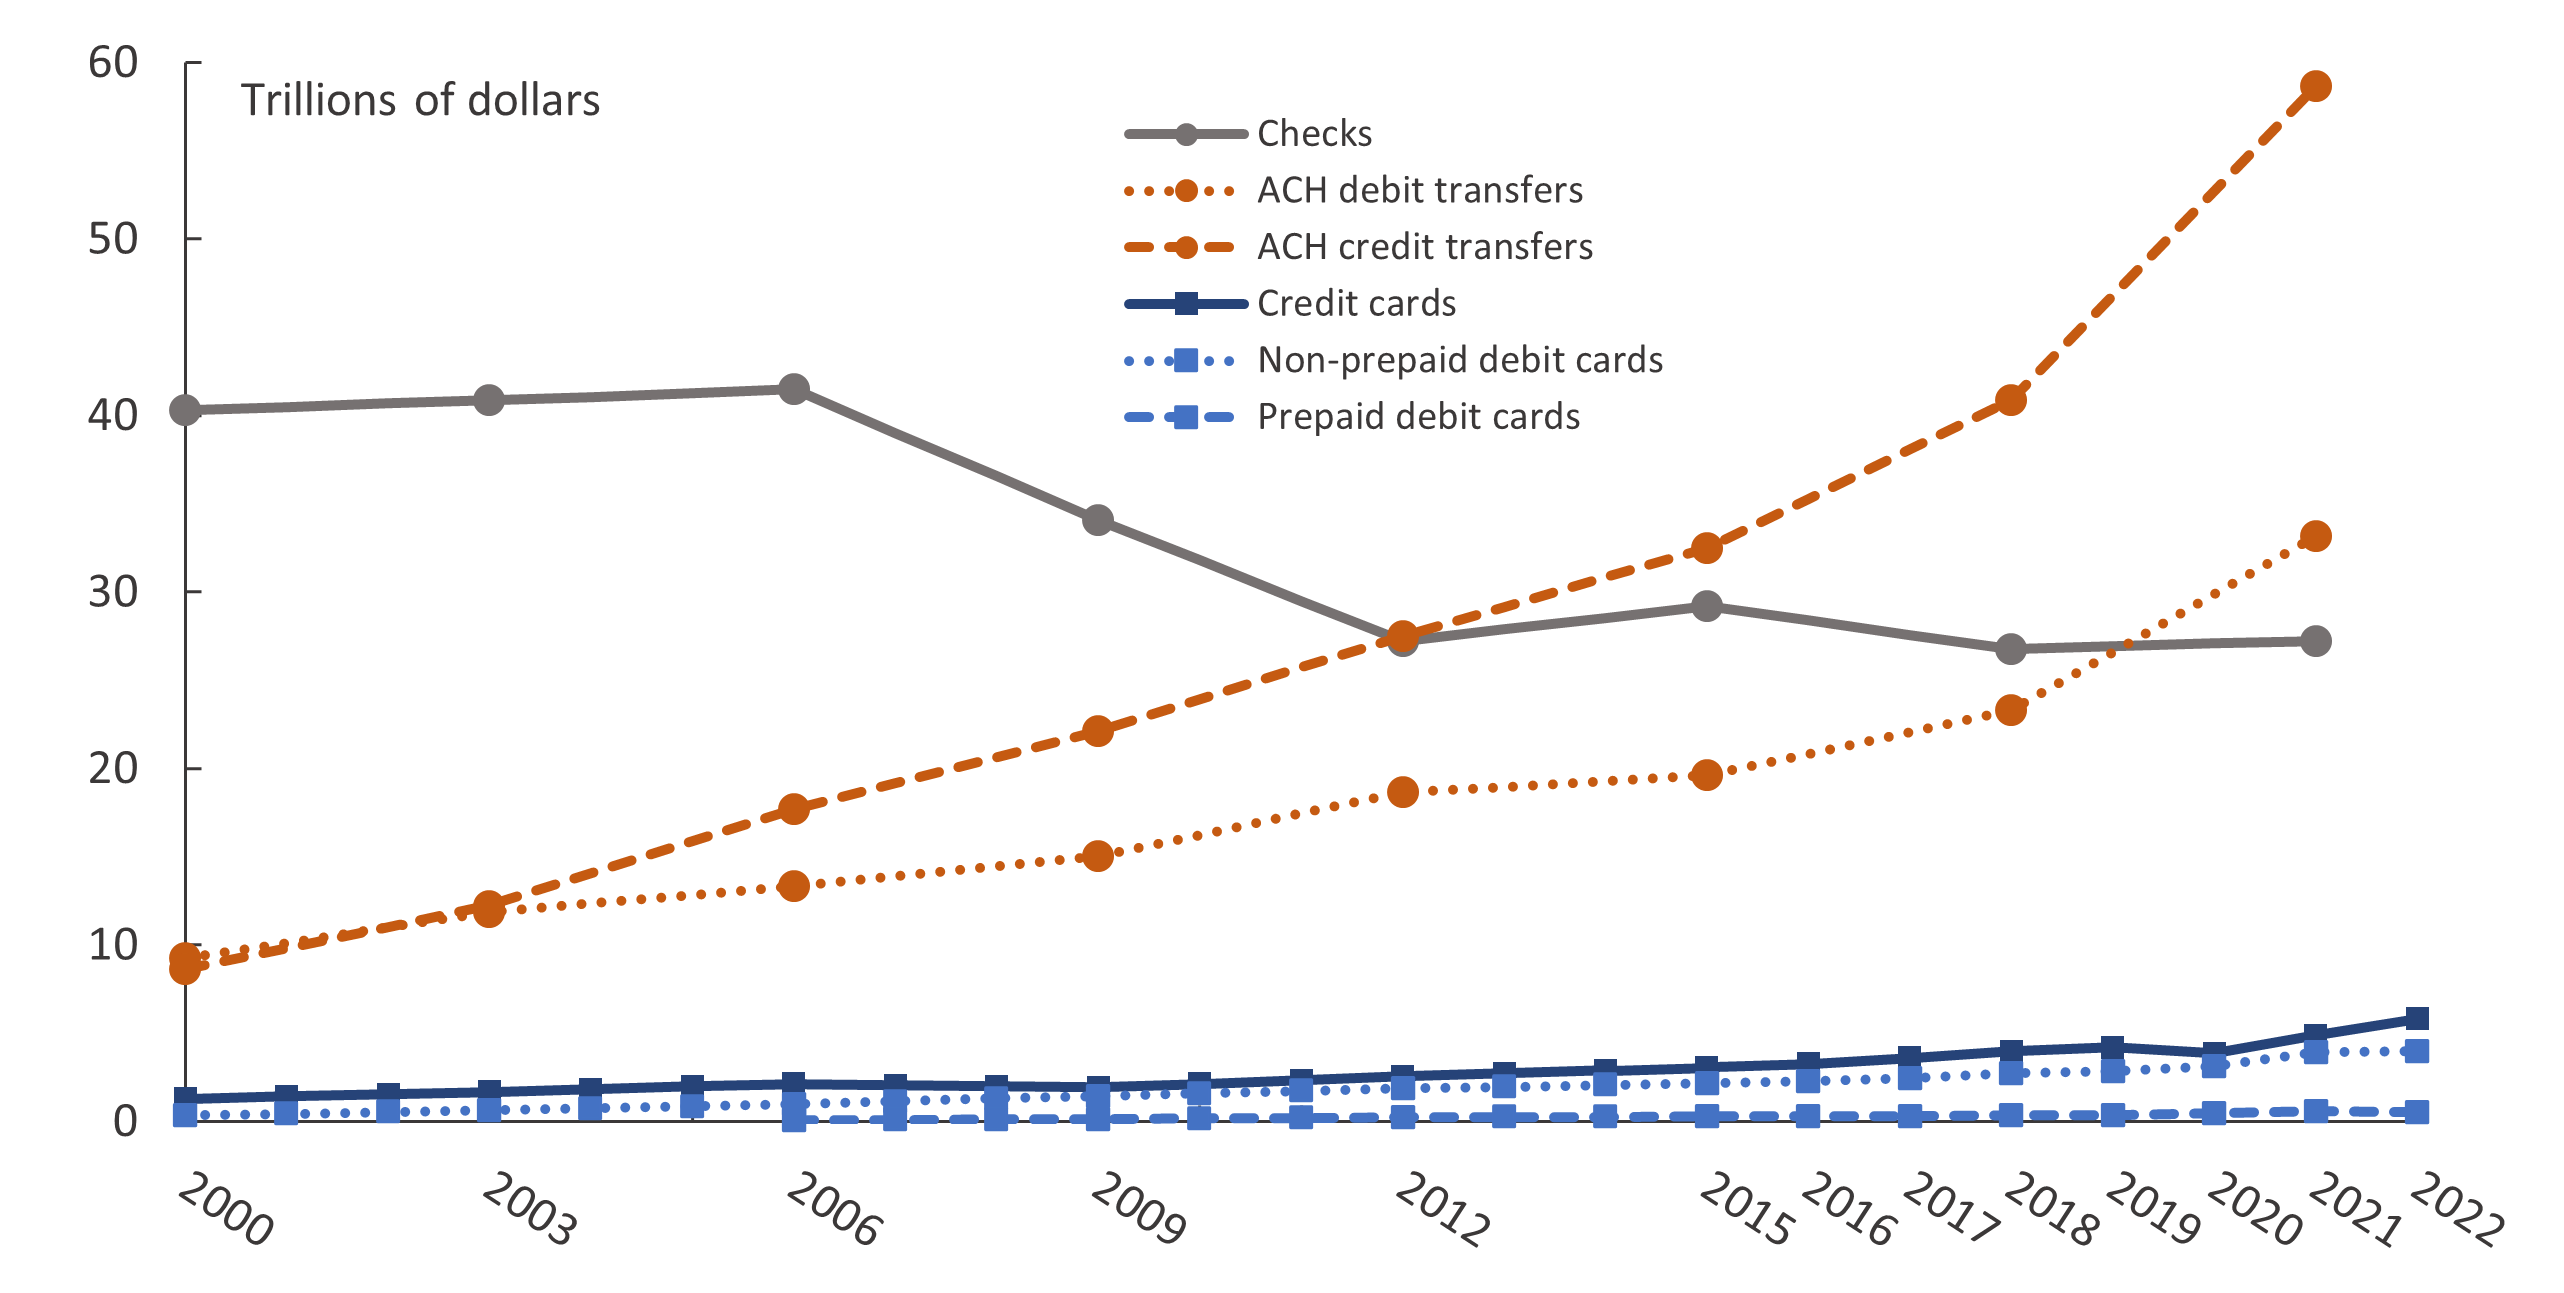
Figure 1. Trends in noncash payments, by value, 2000–22

Note: All estimates are on a triennial basis, except that card payments were estimated for every year since 2015. Credit card payments include general-purpose and private-label versions. Prepaid debit card payments include general-purpose, private-label, and electronic benefits transfer (EBT) versions. Estimates for prepaid debit card payments are not available for 2000 or 2003. The points mark years for which data were collected and estimates were produced. Lines connecting the points are linear interpolations.
Figure 2. Trends in noncash payments, by number, 2000–22

Note: All estimates are on a triennial basis, except that card payments were estimated for every year since 2015. Credit card payments include general-purpose and private-label versions. Prepaid debit card payments include general-purpose, private-label, and electronic benefits transfer (EBT) versions. Estimates for prepaid debit card payments are not available for 2000 or 2003. The points mark years for which data were collected and estimates were produced. Lines connecting the points are linear interpolations.
NPIPS Detailed Data: Contents of Excel Workbook
In addition to the items noted above, this data release includes the following:
- Disaggregated data for GP card payments by type, including GP credit card payments, GP debit card payments, and non-prepaid debit card payments.
- Estimates of these GP card payments by transaction-value range and by consumer and business payers.
- Quarterly estimates for these GP card payments in 2020, 2021, and 2022.
- Estimates of payments processed by online bill payment processors, walk-in bill payment processors, PL ACH debit card processors, and online payment methods, which are the primary alternative to card payments for e-commerce including "buy now, pay later" arrangements.
For more information, see the Notes on the NPIPS Detailed Data.
Data Tables
Contact
For questions, comments, or to be added to the FRPS mailing list, please contact: [email protected].