Microsoft Power BI

Last updated

Microsoft Power BI
Developer(s) Microsoft
Initial release11 July 2011;13 years ago (2011-07-11)
Stable release(s) [±]
WindowsJanuary 2025 Update (2.139.1678.0) / 14 January 2025;13 days ago (2025-01-14) [1] [2] [3]
iOS33.1 / 19 January 2025;8 days ago (2025-01-19) [4]
Android2.2.250122 (Build 21231495) / 22 January 2025;5 days ago (2025-01-22) [5] [6]
Operating system Microsoft Windows
Type Data visualization
Business intelligence
License Proprietary
Website powerbi.microsoft.com

Microsoft Power BI is an interactive data visualization software product developed by Microsoft with a primary focus on business intelligence (BI). [7] It is part of the Microsoft Power Platform. Power BI is a collection of software services, apps, and connectors that work together to turn various sources of data into static and interactive data visualizations. Data may be input by reading directly from a database, webpage, PDF, or structured files such as spreadsheets, CSV, XML, JSON, [8] XLSX, and SharePoint. [9]

Contents

General

Power BI provides cloud-based BI (business intelligence) services, known as "Power BI Services", along with a desktop-based interface, called "Power BI Desktop". It provides data warehouse capabilities including data preparation, data mining, and interactive dashboards. [10] In March 2016, Microsoft released an additional service called Power BI Embedded on its Azure cloud platform. [11] One main differentiator of the product is the ability to load custom visualizations.

History

The software was originally used as Power Pivot and Power Query in Microsoft Excel. This application was originally conceived by Thierry D'Hers and Amir Netz of the SQL Server Reporting Services team at Microsoft. [12] It was originally designed by Ron George in the summer of 2010 and named Project Crescent. [13] Project Crescent was initially available for public download on 11 July 2011, bundled with SQL Server Codename Denali. [14] Later renamed Power BI it was then unveiled by Microsoft in September 2013 as Power BI for Office 365. [15] The first release of Power BI was based on the Microsoft Excel-based add-ins: Power Query, Power Pivot and Power View. With time, Microsoft also added many additional features like question and answers, enterprise-level data connectivity, and security options via Power BI Gateways. [10] Power BI was first released to the general public on 24 July 2015. It has several versions for desktop, web, and mobile app. [16]

Microsoft Power BI logo New Power BI Logo.svg
Microsoft Power BI logo

On 14 April 2015, Microsoft announced that they had acquired the Canadian company Datazen, to "complement Power BI, our cloud-based business analytics service, rounding out our mobile capabilities for customers who need a mobile BI solution implemented on-premises and optimized for SQL Server." [17] Most of the 'visuals' in Power BI started life as Datazen visuals.

Key components

Example of a screenshot from the software Que Productos se Venden Juntos de la Solucion Past2Future Business Intelligence.jpg
Example of a screenshot from the software

Key components of the Power BI ecosystem are as follows:

Power BI Desktop [18]
The Windows desktop-based application for PCs, primarily for designing and publishing reports to the service.
Power BI Service
The SaaS-based (software as a service) online service. This was formerly known as Power BI for Office 365, now referred to as PowerBI.com or simply Power BI.
Power BI Mobile Apps
Power BI Mobile apps are for Android and iOS devices, as well as for Windows phones and tablets.
Power BI Gateway
Gateways are used to sync external data in and out of Power BI and are required for automated refreshes. In enterprise mode, it can also be used by Microsoft Power Automate (previously called Flows) and PowerApps in Office 365.
Power BI Embedded
Power BI REST API can be used to build dashboards and reports into the custom applications that serve Power BI users and non-Power BI users.
Power BI Report Server
An on-premises Power BI is a reporting product for companies that choose not to store data in the cloud-based Power BI Service.
Power BI Premium
Capacity-based offering that includes flexibility to publish reports broadly across an enterprise without requiring recipients to be licensed individually per user. This provides greater scale and performance than shared capacity in the Power BI Service.
Power BI Visuals Marketplace
A marketplace of custom visuals and R-powered visuals. [19]
Power BI Dataflow [20]
A Power Query implementation in the cloud that can be used for data transformations to make a common Power BI Dataset, which can then can be made available for report developers through Microsoft's Common Data Service. For example, it can be used as an alternative to doing transformations in SSAS and may ensure that several report developers use data that has been transformed similarly.
Power BI Dataset
A Power BI Dataset can work as a collection of data for use in Power BI reports, and can either be connected to or imported into a Power BI Report. [21] A dataset can be connected to and get its source data through one or more dataflows.
Power BI Datamart
Within Power BI, the datamart is a container that combines Power BI Dataflows, datasets, and a type of data mart or data warehouse (in the form of an Azure SQL Database) into the same interface. The interface then has the possibility of being a single place for the administration of both the ETL layer (Dataflow), an intermediary data mart (with for instance storage of star schemas, dimension tables, fact tables), and finally the modeling layer (dataset).
Power BI Datahub
A data hub for discovering Power BI datasets within an organization's Power BI Service so that datasets may be reused from one central location. It offers details on the things as well as an access point for working with them, such as building reports on top of them, utilizing them with Excel's Analyze feature, accessing settings, controlling permissions, and more. [22]

Power Query

ETL processes in both the web and desktop versions of Power BI are facilitated in Power Query through built-in connectors to pull data from a wide variety of sources. Power Query provides a GUI which allows users to perform many common data preparation operations without needing to write code, though more advanced operations may be performed through expressions written in the M formula language. [23]

Licenses

Power BI has many different licenses depending on use.

User licenses

Some common user licenses are free, pro, and premium. Free users must be part of an organization with a Power BI license. They can consume reports, and can also build, but not publish. In practice, creators need at least a pro license in order to publish reports. Premium users can publish like a pro but also have more features available for developing.

Workspace licenses

Premium capacity refers to the license of the workspace, not the licenses of its users or creators. Also, access to several features, functionalities, and kinds of content that are exclusively accessible through premium is made possible with a Power BI Premium per-user license. [24] Premium per user is a special workspace license which was added in November 2020, [25] and can be a more affordable alternative to premium workspace licenses for organizations with few users which have advanced analytical requirements. [25]

Paginated reports

Paginated reports for Power BI, which can be built with Power BI Report Builder, are a special type of SSRS reports with pagination formatting which can give better control of the layout of reports which need to be printed to paper or PDF. This is in contrast to regular Power BI reports which instead are optimized for presentation or interactivity and exploration on a screen. Paginated reports can, as of 2022, not be made with the regular Power BI Desktop report builder software. Instead, the standalone Power BI Report Builder has to be used, which can be viewed as a descendant of the SQL Server Reporting Services (SSRS) Microsoft Report Builder for Microsoft SQL Server introduced in 2004. It is also similar to the Report Designer in SQL Server Data Tools.

Power BI Paginated reports are saved in the Report Definition Language (.rdl file format), as opposed to the .pbix file of regular Power BI reports. The RDL format is based on XML and was proposed by Microsoft as a benchmark for defining reports with SSRS.

Paginated reports may be more suitable than regular Power BI reports, and may include printing of invoices or other repeated printouts of reports with a similar layout but different content, or for printing reports where text would otherwise overflow due to being cut off by scrollbars.

Related Research Articles

<span class="mw-page-title-main">Microsoft Office</span> Suite of office software

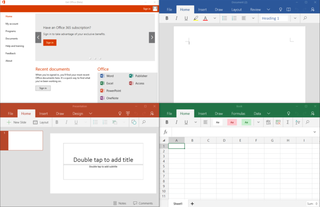
Microsoft Office, MS Office, or simply Office, is an office suite and family of client software, server software, and services developed by Microsoft. The first version of the Office suite, announced by Bill Gates on August 1, 1988 at COMDEX, contained Microsoft Word, Microsoft Excel, and Microsoft PowerPoint — all three of which remain core products in Office — and over time Office applications have grown substantially closer with shared features such as a common spell checker, Object Linking and Embedding data integration and Visual Basic for Applications scripting language. Microsoft also positions Office as a development platform for line-of-business software under the Office Business Applications brand.

<span class="mw-page-title-main">Microsoft Access</span> Database manager part of the Microsoft 365 package

Microsoft Access is a database management system (DBMS) from Microsoft that combines the relational Access Database Engine (ACE) with a graphical user interface and software-development tools. It is a member of the Microsoft 365 suite of applications, included in the Professional and higher editions or sold separately.

FileMaker is a cross-platform relational database application developed by Claris International, a subsidiary of Apple Inc. It integrates a database engine with a graphical user interface (GUI) and security features, allowing users to visually modify a database. Versions for desktops, servers, iOS, and web-delivery have been released.

DataFlex is an object-oriented high-level programming language and a fourth generation visual tool for developing Windows, web and mobile software applications on one framework-based platform. It was introduced and developed by Data Access Corporation beginning in 1982.

A GIS software program is a computer program to support the use of a geographic information system, providing the ability to create, store, manage, query, analyze, and visualize geographic data, that is, data representing phenomena for which location is important. The GIS software industry encompasses a broad range of commercial and open-source products that provide some or all of these capabilities within various information technology architectures.

<span class="mw-page-title-main">ArcGIS</span> Geographic information system maintained by Esri

ArcGIS is a family of client, server and online geographic information system (GIS) software developed and maintained by Esri.

A client access license (CAL) is a commercial software license that allows client computers to use server software services. Most commercial desktop apps are licensed so that payment is required for each installation, but some server products can be licensed so that payment is required for each device or user that accesses the service provided by the software. For example, an instance of Windows Server 2016 for which ten User CALs are purchased allows 10 distinct users to access the server.

SQL Server Reporting Services (SSRS) is a server-based report generating software system from Microsoft. It is part of a suite of Microsoft SQL Server services, including SSAS and SSIS.

Panorama Software is a Canadian software and consulting company specializing in business intelligence. The company was founded by Rony Ross in Israel in 1993; it relocated its headquarters to Toronto, Canada in 2003. Panorama sold its online analytical processing (OLAP) technology to Microsoft in 1996, which was built into Microsoft OLAP Services and later SQL Server Analysis Services, an integrated component of Microsoft SQL Server.

Microsoft SQL Server Compact is a discontinued relational database produced by Microsoft for applications that run on mobile devices and desktops. Prior to the introduction of the desktop platform, it was known as SQL Server for Windows CE and SQL Server Mobile Edition.

<span class="mw-page-title-main">EGroupware</span>

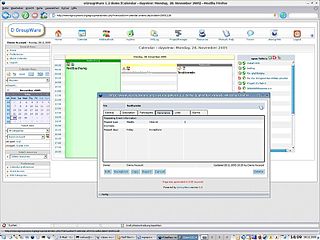
EGroupware is free open-source groupware software intended for businesses from small to enterprises. Its primary functions allow users to manage contacts, appointments, projects and to-do lists. The project releases its software under the terms of GNU General Public License (GPL).

Microsoft SQL Server is a proprietary relational database management system developed by Microsoft. As a database server, it is a software product with the primary function of storing and retrieving data as requested by other software applications—which may run either on the same computer or on another computer across a network. Microsoft markets at least a dozen different editions of Microsoft SQL Server, aimed at different audiences and for workloads ranging from small single-machine applications to large Internet-facing applications with many concurrent users.

<span class="mw-page-title-main">Microsoft Azure SQL Database</span> Managed cloud database

Microsoft Azure SQL Database is a managed cloud database (PaaS) cloud-based Microsoft SQL Servers, provided as part of Microsoft Azure services. The service handles database management functions for cloud based Microsoft SQL Servers including upgrading, patching, backups, and monitoring without user involvement.

<span class="mw-page-title-main">Windows Search</span> Desktop search platform by Microsoft

Windows Search is a content index and desktop search platform by Microsoft introduced in Windows Vista as a replacement for the previous Indexing Service of Windows 2000, Windows XP, and Windows Server 2003, designed to facilitate local and remote queries for files and non-file items in the Windows Shell and in compatible applications. It was developed after the postponement of WinFS and introduced to Windows several benefits of that platform.

Power Pivot, formerly known as PowerPivot, is a self-service business intelligence feature of Microsoft Excel which facilitates the creation of a tabular model to import, relate, and analyze data from a variety of sources.

Data Analysis Expressions (DAX) is the native formula and query language for Microsoft PowerPivot, Power BI Desktop and SQL Server Analysis Services (SSAS) Tabular models. DAX includes some of the functions that are used in Excel formulas with additional functions that are designed to work with relational data and perform dynamic aggregation. It is, in part, an evolution of the Multidimensional Expression (MDX) language developed by Microsoft for Analysis Services multidimensional models combined with Excel formula functions. It is designed to be simple and easy to learn, while exposing the power and flexibility of PowerPivot and SSAS tabular models.

Google Cloud Platform (GCP) is a suite of cloud computing services offered by Google that provides a series of modular cloud services including computing, data storage, data analytics, and machine learning, alongside a set of management tools. It runs on the same infrastructure that Google uses internally for its end-user products, such as Google Search, Gmail, and Google Docs, according to Verma et al. Registration requires a credit card or bank account details.

Realm is an open source object database management system, initially for mobile operating systems (Android/iOS) but also available for platforms such as Xamarin, React Native, and others, including desktop applications (Windows). It is licensed under the Apache License.

<span class="mw-page-title-main">Microsoft 365</span> Subscription services offered by Microsoft

Microsoft 365 is a product family of productivity software, collaboration and cloud-based services owned by Microsoft. It encompasses online services such as Outlook.com, OneDrive, Microsoft Teams, programs formerly marketed under the name Microsoft Office, and enterprise products and services associated with these products such as Exchange Server, SharePoint, and Viva Engage. Microsoft 365 also covers subscription plans encompassing these products, including those that include subscription-based licenses to desktop and mobile software, and hosted email and intranet services.

<span class="mw-page-title-main">Power Query</span> ETL tool developed by Microsoft

Power Query is an ETL tool created by Microsoft for data extraction, loading and transformation, and is used to retrieve data from sources, process it, and load them into one or more target systems. Power Query is available in several variations within the Microsoft Power Platform, and is used for business intelligence on fully or partially self-service platforms. It is found in software such as Excel, Power BI, Analysis Services, Dataverse, Power Apps, Azure Data Factory, SSIS, Dynamics 365, and in cloud services such as Microsoft Dataflows, including Power BI Dataflow used with the online Power BI Service or the somewhat more generic version of Microsoft Dataflow used with Power Automate.

References

  1. "Power BI Desktop". Microsoft Apps. Retrieved 24 January 2025.
  2. "Microsoft Power BI Desktop". Microsoft. Retrieved 24 January 2025.
  3. LeBlanc, Patrick (14 January 2025). "Power BI January 2025 Feature Summary". Microsoft Power BI. Retrieved 24 January 2025.
  4. "Microsoft Power BI". App Store. Retrieved 24 January 2025.
  5. "Microsoft Power BI". Google Play. Retrieved 24 January 2025.
  6. "Microsoft Power BI 2.2.250122.21231495". APKMirror. 22 January 2025. Retrieved 24 January 2025.
  7. "Bring your data to life with Microsoft Power BI". Microsoft.com. Microsoft. Archived from the original on 27 May 2019. Retrieved 4 May 2016.
  8. "List of all Power Query connectors - Power Query". learn.microsoft.com. 31 March 2023. Archived from the original on 11 July 2023. Retrieved 11 July 2023.
  9. "How to Design Power BI Dashboard: A Step-by-Step Guide". lookuplinks.com. 5 August 2023. Archived from the original on 26 September 2023. Retrieved 24 September 2023.
  10. 1 2 "Magic Quadrant for Business Intelligence and Analytics Platforms". Gartner.com. Gartner, Inc. Archived from the original on 29 May 2018. Retrieved 4 May 2016.
  11. Caldwell, Nick (31 March 2016). "Embed the wow of Power BI in your applications with Microsoft Power BI Embedded!". Powerbi.microsoft.com. Microsoft. Archived from the original on 18 February 2019. Retrieved 4 May 2016.
  12. "A Glimpse at Project Crescent". Microsoft BI Blog. Microsoft. 9 November 2010. Archived from the original on 24 March 2016. Retrieved 29 June 2017.
  13. "Data Visualization Done Right: Project Crescent". Microsoft BI Blog. Microsoft. 9 November 2010. Archived from the original on 31 August 2017. Retrieved 29 June 2017.
  14. Unkroth, Kay (12 July 2011). "Announcing Microsoft SQL Server Code Name "Denali" Community Technology Preview 3 (CTP3)". blogs.msdn.microsoft.com. Microsoft. Archived from the original on 25 April 2017. Retrieved 28 May 2019.
  15. "Office 365 Gets Colorful 3D Charts, Natural Language Search". PC Mag India. ZiffDavis, LLC PCMag India. 26 September 2013. Archived from the original on 16 December 2019. Retrieved 4 May 2016.
  16. The Power BI Team, Microsoft (10 July 2015). "Announcing Power BI general availability coming July 24th". Microsoft Power BI Blog. Microsoft. Archived from the original on 12 August 2021. Retrieved 4 May 2016.
  17. Hathi, Kamal (14 April 2015). "Microsoft acquires mobile business intelligence leader Datazen". blogs.microsoft.com. Microsoft, Inc. Archived from the original on 10 January 2022. Retrieved 10 January 2022.
  18. Hyman, Jack (8 February 2022). Microsoft Power BI for dummies. NJ: wiley. pp. 47–62. ISBN   978-1-119-82487-9.
  19. "Power BI Custom visuals on AppSource". Microsoft AppSource. Microsoft. 25 December 2017. Archived from the original on 26 December 2017. Retrieved 25 December 2017.
  20. "Creating a dataflow - Power BI | Microsoft Docs". Archived from the original on 24 February 2022. Retrieved 24 February 2022.
  21. Get started, Power BI (3 October 2022). "Basic concepts for designers in the Power BI service". Archived from the original on 24 March 2022. Retrieved 4 April 2022.
  22. paulinbar. "Data discovery using the data hub - Power BI". learn.microsoft.com. Archived from the original on 11 March 2023. Retrieved 11 March 2023.
  23. Puls, Ken; Escobar, Miguel (2021). Master Your Data with Excel and Power BI: Leveraging Power Query to Get & Transform Your Task Flow ; Formerly M is for Data Monkey (2nd ed.). Chicago: Holy Macro! Books. ISBN   978-1-61547-058-7.
  24. kfollis. "Power BI service features by license type - Power BI". learn.microsoft.com. Archived from the original on 27 November 2022. Retrieved 27 November 2022.
  25. 1 2 Meet Power BI Premium per user element61

Further reading