| Eastbourne | |
|---|---|
| Borough constituency for the House of Commons | |
 Interactive map of boundaries from 2024 | |
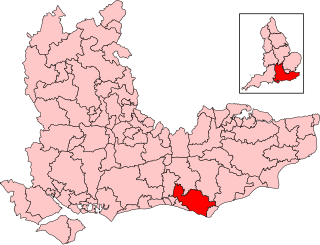
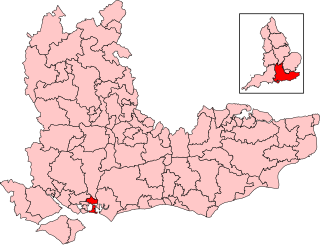
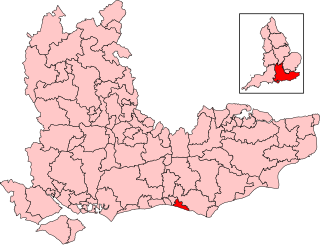
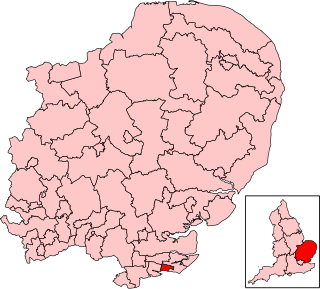
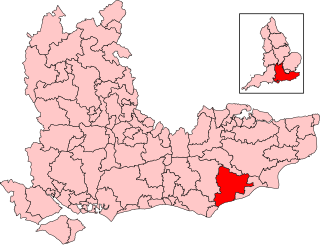
 Boundary of Eastbourne in South East England | |
| County | East Sussex |
| Electorate | 73,322 (2023) [1] |
| Major settlements | Eastbourne |
| Current constituency | |
| Created | 1885 |
| Member of Parliament | Josh Babarinde (Liberal Democrats) |
| Seats | One |
| Created from | East Sussex |
Eastbourne is a constituency for the House of Commons of the UK Parliament. It was created as one of nine in Sussex in 1885, since when it has reduced in geographic size reflecting the growth of its main settlement, Eastbourne. [n 1]
Contents
- Constituency profile
- History
- Origin
- Boundaries
- From safe seat to marginal seat
- Members of Parliament
- By-elections
- Election results
- Elections in the 2020s
- Elections in the 2010s
- Elections in the 2000s
- Elections in the 1990s
- Elections in the 1980s
- Elections in the 1970s
- Elections in the 1960s
- Elections in the 1950s
- Election in the 1940s
- Elections in the 1930s
- Elections in the 1920s
- Elections in the 1910s
- Elections in the 1900s
- Elections in the 1890s
- Elections in the 1880s
- See also
- Notes
- References
- Sources
- External links
The seat was won in 2024 by Josh Babarinde, a Liberal Democrat MP, beating Conservative MP Caroline Ansell. Ansell held the seat from 2015 to 2017 and again from 2019 to 2024, in both cases beating the Liberal Democrat MP Stephen Lloyd, who held it from 2010 to 2015 and again from 2017 to 2019. [n 2] Since the seat's creation it has been won by candidates from either of these two political parties (and their early forebears, the Liberal Party and the Unionist Party). The seat has had four by-elections, most recently in 1990.
For 94 years of the 20th Century, the seat was represented by Conservative MPs. The seat in the 1930s saw three unopposed candidates: in 1932, March 1935 and November 1935. More recently, Eastbourne has been considered relative to others a very marginal seat, or swing seat. In the nine elections from 1990 to 2019, the winning majority was never more than 10%, and the seat changed hands between the Conservative and Liberal Democrat candidates in seven of the last ten elections.