Elections to City of Bradford Metropolitan District Council were held on were held on Thursday, 1 May 1980, with boundary changes prompting the entirety of the council to be elected.
The boundary changes subtracted a ward from the existing 31 - decreasing the councillor total by three to 90 - with just under half the ward names surviving the changes:
Abolished:
| Created:
|
|
The election resulted in the Labour gaining control of the council directly from the Conservatives. [1] [2]
Party | Seats | Gains | Losses | Net gain/loss | Seats % | Votes % | Votes | +/− | |
---|---|---|---|---|---|---|---|---|---|
Labour | 50 | 0 | 0 | 0 | 55.5 | 46.1 | 66,916 | +0.0% | |
Conservative | 37 | 0 | 0 | 0 | 41.1 | 41.4 | 60,088 | -3.1% | |
Liberal | 3 | 0 | 0 | 0 | 3.3 | 10.8 | 15,736 | +1.5% | |
Ecology | 0 | 0 | 0 | 0 | 0.0 | 0.9 | 1,295 | +0.9% | |
Ratepayers & Residents Association | 0 | 0 | 0 | 0 | 0.0 | 0.4 | 516 | +0.4% | |
Independent | 0 | 0 | 0 | 0 | 0.0 | 0.3 | 431 | +0.2% | |
This result had the following consequences for the total number of seats on the council after the elections:
Party | Previous council | New council | |||
---|---|---|---|---|---|
Labour | 38 | 50 | |||
Conservatives | 51 | 37 | |||
Liberals | 4 | 3 | |||
Total | 93 | 90 | |||
Working majority | -9 | 10 |
Party | Candidate | Votes | % | ±% | |
---|---|---|---|---|---|
Liberal | M. Atkinson | 3,389 | 46.8 | N/A | |
Conservative | A. Lightowler | 2,629 | 36.3 | N/A | |
Conservative | D. Moore | 2,394 | |||
Liberal | K. Greenwood | 1,903 | |||
Liberal | M. Greenwood | 1,732 | |||
Labour | I. Alan | 1,222 | 16.9 | N/A | |
Labour | K. Briggs | 1,214 | |||
Labour | S. Lancaster | 1,088 | |||
Majority | 763 | 10.5 | N/A | ||
Turnout | 7,237 | N/A | |||
Liberal win (new seat) | |||||
Conservative win (new seat) | |||||
Conservative win (new seat) |
Party | Candidate | Votes | % | ±% | |
---|---|---|---|---|---|
Conservative | J. Booth | 2,166 | 43.3 | N/A | |
Conservative | T. Shaw | 2,092 | |||
Conservative | W. Nunn | 2,069 | |||
Labour | M. Mould | 1,757 | 35.2 | N/A | |
Liberal | M. Tregoning | 1,075 | 21.5 | N/A | |
Liberal | J. Whitehead | 936 | |||
Majority | 409 | 8.2 | N/A | ||
Turnout | 4,998 | N/A | |||
Conservative win (new seat) | |||||
Conservative win (new seat) |
Party | Candidate | Votes | % | ±% | |
---|---|---|---|---|---|
Conservative | E. Hall | 2,890 | 55.7 | N/A | |
Conservative | D. Conquest | 2,713 | |||
Conservative | J. Womersley | 2,611 | |||
Labour | C. Wall | 1,340 | 25.8 | N/A | |
Liberal | E. Roberts | 962 | 18.5 | N/A | |
Liberal | S. Clemence | 925 | |||
Majority | 1,550 | 29.8 | N/A | ||
Turnout | 5,192 | N/A | |||
Conservative win (new seat) | |||||
Conservative win (new seat) |
Party | Candidate | Votes | % | ±% | |
---|---|---|---|---|---|
Labour | J. Ryan | 2,131 | 50.2 | N/A | |
Conservative | T. Hall | 2,112 | 49.8 | N/A | |
Labour | J. Allinson | 2,112 | |||
Labour | A. Scriven | 2,076 | |||
Conservative | F. Lee | 2,048 | |||
Conservative | E. Wooler | 2,001 | |||
Majority | 19 | 0.4 | N/A | ||
Turnout | 4,243 | N/A | |||
Labour win (new seat) | |||||
Conservative win (new seat) | |||||
Labour win (new seat) |
Party | Candidate | Votes | % | ±% | |
---|---|---|---|---|---|
Labour | L. Coughlin | 3,229 | 74.4 | N/A | |
Labour | T. Wood | 3,202 | |||
Labour | S. Gratton | 3,187 | |||
Conservative | J. Claughton | 1,110 | 25.6 | N/A | |
Conservative | P. Moore | 1,082 | |||
Conservative | E. Swanson | 1,064 | |||
Majority | 2,119 | 48.8 | N/A | ||
Turnout | 4,339 | N/A | |||
Labour win (new seat) | |||||
Labour win (new seat) |
Party | Candidate | Votes | % | ±% | |
---|---|---|---|---|---|
Labour | P. Clarke | 3,289 | 68.9 | N/A | |
Labour | J. Lambert | 3,230 | |||
Labour | J. McKenna | 3,203 | |||
Conservative | L. Kelly | 1,483 | 31.1 | N/A | |
Conservative | G. Crossley | 1,442 | |||
Conservative | M. Choudhury | 1,303 | |||
Majority | 1,806 | 37.8 | N/A | ||
Turnout | 4,772 | N/A | |||
Labour win (new seat) | |||||
Labour win (new seat) |
Party | Candidate | Votes | % | ±% | |
---|---|---|---|---|---|
Conservative | J. Hirst | 2,266 | 50.6 | N/A | |
Conservative | R. Farley | 2,246 | |||
Conservative | G. Seager | 2,224 | |||
Labour | G. Mitchell | 2,216 | 49.4 | N/A | |
Labour | E. Stead | 2,118 | |||
Labour | R. Baxter | 2,083 | |||
Majority | 50 | 1.1 | N/A | ||
Turnout | 4,482 | N/A | |||
Conservative win (new seat) | |||||
Conservative win (new seat) |
Party | Candidate | Votes | % | ±% | |
---|---|---|---|---|---|
Conservative | E. Hawkins | 2,218 | 40.7 | N/A | |
Conservative | A. Jerome | 2,212 | |||
Conservative | J. Barker | 2,204 | |||
Liberal | R. Binns | 1,883 | 34.5 | N/A | |
Liberal | E. Drew | 1,727 | |||
Liberal | J. Wells | 1,637 | |||
Labour | J. Lawrence | 1,353 | 24.8 | N/A | |
Majority | 335 | 6.1 | N/A | ||
Turnout | 5,454 | N/A | |||
Conservative win (new seat) | |||||
Conservative win (new seat) |
Party | Candidate | Votes | % | ±% | |
---|---|---|---|---|---|
Labour | A. Dewhirst | 2,652 | 51.6 | N/A | |
Labour | P. Lancaster | 2,583 | |||
Labour | L. Crawforth | 2,528 | |||
Conservative | S. Swallow | 1,974 | 38.4 | N/A | |
Conservative | P. Heaton | 1,853 | |||
Conservative | J. Lewis | 1,845 | |||
Ratepayers & Residents Association | J. Foulds | 516 | 10.0 | N/A | |
Majority | 678 | 13.2 | N/A | ||
Turnout | 5,142 | N/A | |||
Labour win (new seat) | |||||
Labour win (new seat) |
Party | Candidate | Votes | % | ±% | |
---|---|---|---|---|---|
Labour | M. Thornton | 2,840 | 55.4 | N/A | |
Labour | J. Godward | 2,780 | |||
Labour | B. Kearns | 2,770 | |||
Conservative | J. Rawnsley | 2,286 | 44.6 | N/A | |
Conservative | H. Ormondroyd | 2,228 | |||
Conservative | S. Briggs | 2,153 | |||
Majority | 554 | 10.8 | N/A | ||
Turnout | 5,126 | N/A | |||
Labour win (new seat) | |||||
Labour win (new seat) |
Party | Candidate | Votes | % | ±% | |
---|---|---|---|---|---|
Conservative | J. King | 2,884 | 61.1 | N/A | |
Conservative | D. Emmott | 2,876 | |||
Conservative | C. Hobson | 2,776 | |||
Labour | H. Rashid | 1,838 | 38.9 | N/A | |
Labour | D. McElroy | 1,742 | |||
Labour | J. Bruce | 1,730 | |||
Majority | 1,046 | 22.1 | N/A | ||
Turnout | 4,722 | N/A | |||
Conservative win (new seat) | |||||
Conservative win (new seat) |
Party | Candidate | Votes | % | ±% | |
---|---|---|---|---|---|
Liberal | P. Hockney | 2,015 | 38.0 | N/A | |
Labour | K. Baxter | 1,830 | 34.5 | N/A | |
Liberal | A. Bagshaw | 1,661 | |||
Labour | A. Emsley | 1,649 | |||
Labour | A. Miller | 1,610 | |||
Liberal | L. Rennison | 1,506 | |||
Conservative | T. Keighley | 1,457 | 27.5 | N/A | |
Conservative | A. Garnett | 1,399 | |||
Conservative | R. Hughes-Rowlands | 1,248 | |||
Majority | 185 | 3.5 | N/A | ||
Turnout | 5,302 | N/A | |||
Liberal win (new seat) | |||||
Labour win (new seat) | |||||
Liberal win (new seat) |
Party | Candidate | Votes | % | ±% | |
---|---|---|---|---|---|
Conservative | J. Spencer | 2,693 | 55.3 | N/A | |
Conservative | J. Lightband | 2,626 | |||
Conservative | A. Turner | 2,452 | |||
Liberal | T. Crawshaw | 1,175 | 24.1 | N/A | |
Liberal | S. Hobson | 1,091 | |||
Labour | |||||
Ecology | J. Fielding | 568 | 11.7 | N/A | |
Independent | C. Poole | 431 | 8.9 | N/A | |
Ecology | R. Adsell | 350 | |||
Majority | 1,518 | 31.2 | N/A | ||
Turnout | 4,867 | N/A | |||
Conservative win (new seat) | |||||
Conservative win (new seat) |
Party | Candidate | Votes | % | ±% | |
---|---|---|---|---|---|
Conservative | P. Gilmour | 2,193 | 43.9 | N/A | |
Conservative | A. Trigg | 2,089 | |||
Labour | R. Hardacre | 2,028 | 40.6 | N/A | |
Labour | F. Sunderland | 1,974 | |||
Conservative | D. Smith | 1,877 | |||
Labour | M. Allison | 1,833 | |||
Liberal | G. Sims | 776 | 15.5 | N/A | |
Liberal | P. Harrison | 618 | |||
Majority | 165 | 3.3 | N/A | ||
Turnout | 4,997 | N/A | |||
Conservative win (new seat) | |||||
Labour win (new seat) |
Party | Candidate | Votes | % | ±% | |
---|---|---|---|---|---|
Labour | W. Clarkson | 2,440 | 58.9 | N/A | |
Labour | E. Newby | 2,343 | |||
Labour | H. Peacock | 2,314 | |||
Liberal | J. Brooksbank | 867 | 20.9 | N/A | |
Conservative | G. Dawson | 839 | 20.2 | N/A | |
Conservative | J. Maxfield | 736 | |||
Conservative | T. McDaid | 718 | |||
Liberal | D. Beaumont | 631 | |||
Liberal | S. Green | 581 | |||
Majority | 1,573 | 37.9 | N/A | ||
Turnout | 4,146 | N/A | |||
Labour win (new seat) | |||||
Labour win (new seat) |
Party | Candidate | Votes | % | ±% | |
---|---|---|---|---|---|
Labour | S. Bowen | 2,632 | 49.4 | N/A | |
Labour | B. Thorne | 2,620 | |||
Labour | P. Beeley | 2,483 | |||
Conservative | M. Cowen | 2,205 | 41.4 | N/A | |
Conservative | H. Harrison | 2,077 | |||
Conservative | N. Smith | 1,975 | |||
Liberal | R. Taylor | 491 | 9.2 | N/A | |
Liberal | W. Edge | 452 | |||
Majority | 427 | 8.0 | N/A | ||
Turnout | 5,328 | N/A | |||
Labour win (new seat) | |||||
Labour win (new seat) |
Party | Candidate | Votes | % | ±% | |
---|---|---|---|---|---|
Labour | T. Brown | 2,923 | 75.1 | N/A | |
Labour | A. Hameed | 2,685 | |||
Labour | K. Ryalls | 2,672 | |||
Conservative | V. Holdsworth | 968 | 24.9 | N/A | |
Conservative | B. Robinson | 837 | |||
Conservative | R. Robinson | 800 | |||
Majority | 1,955 | 50.2 | N/A | ||
Turnout | 3,891 | N/A | |||
Labour win (new seat) | |||||
Labour win (new seat) |
Party | Candidate | Votes | % | ±% | |
---|---|---|---|---|---|
Labour | D. Bentley | 2,734 | 57.0 | N/A | |
Labour | J. Coope | 2,552 | |||
Labour | K. Parker | 2,487 | |||
Conservative | D. Mellor | 2,065 | 43.0 | N/A | |
Conservative | T. Hill | 1,985 | |||
Conservative | A. Rawnsley | 1,966 | |||
Majority | 669 | 13.9 | N/A | ||
Turnout | 4,799 | N/A | |||
Labour win (new seat) | |||||
Labour win (new seat) |
Party | Candidate | Votes | % | ±% | |
---|---|---|---|---|---|
Conservative | I. Cookland | 2,438 | 51.2 | N/A | |
Conservative | J. Hirst | 2,363 | |||
Labour | J. Smith | 2,323 | 48.8 | N/A | |
Labour | H. Alpin | 2,320 | |||
Conservative | J. Rees | 2,238 | |||
Labour | L. Woodward | 2,201 | |||
Majority | 115 | 2.4 | N/A | ||
Turnout | 4,761 | N/A | |||
Conservative win (new seat) | |||||
Labour win (new seat) |
Party | Candidate | Votes | % | ±% | |
---|---|---|---|---|---|
Conservative | W. Clavering | 2,942 | 56.9 | N/A | |
Conservative | K. Emsley | 2,876 | |||
Conservative | A. Raistrick | 2,702 | |||
Liberal | C. Svensgaard | 931 | 18.0 | N/A | |
Labour | L. Fox | 817 | 15.8 | N/A | |
Labour | D. Warwick | 809 | |||
Liberal | K. Powell | 774 | |||
Labour | A. Pisacane | 735 | |||
Liberal | V. Whelan | 732 | |||
Ecology | P. Burnell | 476 | 9.2 | N/A | |
Majority | 2,011 | 38.9 | N/A | ||
Turnout | 5,166 | N/A | |||
Conservative win (new seat) | |||||
Conservative win (new seat) |
Party | Candidate | Votes | % | ±% | |
---|---|---|---|---|---|
Labour | N. Free | 3,008 | 62.9 | N/A | |
Labour | E. Saville | 2,916 | |||
Labour | C. Hunter | 2,780 | |||
Conservative | R. Wright | 1,121 | 23.5 | N/A | |
Conservative | A. Shutt | 1,050 | |||
Conservative | P. Barker | 996 | |||
Liberal | D. Atkinson | 399 | 8.3 | N/A | |
Liberal | R. Barker | 368 | |||
Ecology | K. Taylor | 251 | 5.3 | N/A | |
Ecology | C. Ormondroyd | 237 | |||
Ecology | P. Dean | 195 | |||
Majority | 1,887 | 39.5 | N/A | ||
Turnout | 4,779 | N/A | |||
Labour win (new seat) | |||||
Labour win (new seat) |
Party | Candidate | Votes | % | ±% | |
---|---|---|---|---|---|
Conservative | O. Messer | 3,138 | 54.1 | N/A | |
Conservative | J. Evans | 3,122 | |||
Conservative | S. Arthur | 3,089 | |||
Labour | M. Ryan | 1,984 | 34.2 | N/A | |
Labour | J. Jones | 1,912 | |||
Labour | K. Trobridge | 1,845 | |||
Liberal | G. Roberts | 683 | 11.8 | N/A | |
Liberal | R. Cole | 617 | |||
Majority | 1,154 | 19.9 | N/A | ||
Turnout | 5,805 | N/A | |||
Conservative win (new seat) | |||||
Conservative win (new seat) |
Party | Candidate | Votes | % | ±% | |
---|---|---|---|---|---|
Labour | I. Wassell | 2,056 | 44.8 | N/A | |
Conservative | E. Kinder | 2,048 | 44.6 | N/A | |
Labour | A. Heaney | 2,035 | |||
Conservative | D. Downey | 2,019 | |||
Labour | B. Draxler | 1,969 | |||
Conservative | R. Smith | 1,966 | |||
Liberal | D. Garrad | 486 | 10.6 | N/A | |
Liberal | N. Baggley | 479 | |||
Liberal | L. Baggley | 453 | |||
Majority | 8 | 0.2 | N/A | ||
Turnout | 4,590 | N/A | |||
Labour win (new seat) | |||||
Conservative win (new seat) | |||||
Labour win (new seat) |
Party | Candidate | Votes | % | ±% | |
---|---|---|---|---|---|
Labour | G. Armitage | 2,379 | 50.0 | N/A | |
Conservative | A. Pollard | 2,378 | 50.0 | N/A | |
Labour | H. Baines | 2,314 | |||
Conservative | D. Barker | 2,306 | |||
Conservative | B. Curtis | 2,289 | |||
Labour | A. Spiers | 2,272 | |||
Majority | 1 | 0.0 | N/A | ||
Turnout | 4,757 | N/A | |||
Labour win (new seat) | |||||
Conservative win (new seat) | |||||
Labour win (new seat) |
Party | Candidate | Votes | % | ±% | |
---|---|---|---|---|---|
Labour | J. Senior | 2,795 | 77.7 | N/A | |
Labour | T. Mahon | 2,698 | |||
Labour | D. Smith | 2,632 | |||
Conservative | V. Owen | 800 | 22.3 | N/A | |
Conservative | J. Butterfield | 764 | |||
Majority | 1,995 | 55.5 | N/A | ||
Turnout | 3,595 | N/A | |||
Labour win (new seat) | |||||
Labour win (new seat) |
Party | Candidate | Votes | % | ±% | |
---|---|---|---|---|---|
Labour | G. Goodyear | 2,637 | 60.4 | N/A | |
Labour | E. Haslan | 2,559 | |||
Labour | R. Sowman | 2,456 | |||
Conservative | H. Ibbotson | 1,727 | 39.6 | N/A | |
Conservative | D. Davison | 1,701 | |||
Conservative | A. Craig | 1,600 | |||
Majority | 910 | 20.8 | N/A | ||
Turnout | 4,364 | N/A | |||
Labour win (new seat) | |||||
Labour win (new seat) |
Party | Candidate | Votes | % | ±% | |
---|---|---|---|---|---|
Labour | M. Ajeeb | 3,911 | 80.7 | N/A | |
Labour | D. Coughlin | 3,717 | |||
Labour | I. Queriski | 3,597 | |||
Conservative | D. Baggley | 933 | 19.3 | N/A | |
Conservative | M. Qureshi | 771 | |||
Conservative | Z. Khan | 734 | |||
Majority | 2,978 | 61.5 | N/A | ||
Turnout | 4,844 | N/A | |||
Labour win (new seat) | |||||
Labour win (new seat) |
Party | Candidate | Votes | % | ±% | |
---|---|---|---|---|---|
Conservative | F. Hillam | 2,193 | 51.2 | N/A | |
Labour | F. Bastow | 2,087 | 48.8 | N/A | |
Labour | A. Corina | 2,020 | |||
Conservative | A. Hodgson | 2,016 | |||
Labour | L. Kearns | 1,995 | |||
Conservative | H. Thorne | 1,902 | |||
Majority | 106 | 2.5 | N/A | ||
Turnout | 4,280 | N/A | |||
Conservative win (new seat) | |||||
Labour win (new seat) | |||||
Labour win (new seat) |
Party | Candidate | Votes | % | ±% | |
---|---|---|---|---|---|
Conservative | G. Hodgson | 2,270 | 52.2 | N/A | |
Conservative | Eric Pickles | 2,229 | |||
Conservative | S. Midgley | 2,210 | |||
Labour | C. Foster | 1,475 | 33.9 | N/A | |
Labour | S. Cliff | 1,475 | |||
Labour | H. Laws | 1,436 | |||
Liberal | M. Kershaw | 604 | 13.9 | N/A | |
Majority | 795 | 18.3 | N/A | ||
Turnout | 4,349 | N/A | |||
Conservative win (new seat) | |||||
Conservative win (new seat) |
Party | Candidate | Votes | % | ±% | |
---|---|---|---|---|---|
Labour | D. Birdsall | 2,990 | 64.2 | N/A | |
Labour | B. Lynch | 2,664 | |||
Labour | D. Mangham | 2,654 | |||
Conservative | H. Midgley | 1,665 | 35.8 | N/A | |
Conservative | R. George | 1,585 | |||
Conservative | D. Owen | 1,448 | |||
Majority | 1,325 | 28.5 | N/A | ||
Turnout | 4,655 | N/A | |||
Labour win (new seat) | |||||
Labour win (new seat) |
Nuneaton and Bedworth is a local government district with borough status in Warwickshire, England. It includes the towns of Nuneaton and Bedworth, as well as a modest rural hinterland including the village of Bulkington.
The 2004 United Kingdomlocal elections were held on Thursday 10 June 2004, along with the European elections and the London mayoral and Assembly elections.
Keighley is a constituency in West Yorkshire created in 1885 represented in the House of Commons of the UK Parliament since 2019 by Robbie Moore of the Conservative Party.
Bowling and Barkerend is an electoral ward within the City of Bradford Metropolitan District Council. The population at the 2011 Census was 20,618.
City of Bradford Metropolitan District Council elections are held three years out of every four to elect members to City of Bradford Metropolitan District Council in West Yorkshire, England. Since the last boundary changes in 2004 the council has comprised 90 councillors representing 30 wards, with each ward electing three councillors.
South Oxfordshire District Council, a non-metropolitan district council in Oxfordshire, England is elected every four years.
North Dorset District Council in Dorset, England existed from 1974 to 2019, when it was abolished and subsumed into Dorset Council.
Tonbridge and Malling Borough Council is the local authority for the borough of Tonbridge and Malling in Kent, United Kingdom. The council is elected every four years. Since the last boundary changes in 2023, 44 councillors have been elected from 19 wards.
City of Bradford Metropolitan District Council is the local authority of the City of Bradford in West Yorkshire, England. It is a metropolitan district council, one of five in West Yorkshire and one of 36 in the metropolitan counties of England, and provides the majority of local government services in Bradford. Since 2014 it has been a constituent member of the West Yorkshire Combined Authority.
Ribble Valley Borough Council elections are held every four years. Ribble Valley Borough Council is the local authority for the non-metropolitan district of Ribble Valley in Lancashire, England. Since the last boundary changes in 2019, 40 councillors have been elected from 26 wards.
Anfield ward is an electoral district of Liverpool City Council centred on the Anfield district of Liverpool. The ward is within the Liverpool Walton Parliamentary constituency.
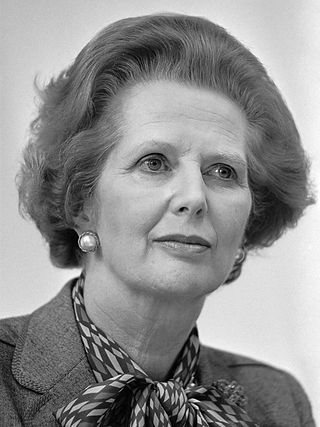
Local elections were held in the United Kingdom in 1980. These were the first annual local elections for the new Conservative Prime Minister Margaret Thatcher. Though the Conservatives in government lost seats, the projected share of the vote was close: Labour Party 42%, Conservative Party 40%, Liberal Party 13%. Labour were still being led by the former prime minister James Callaghan, who resigned later in the year to be succeeded by Michael Foot.
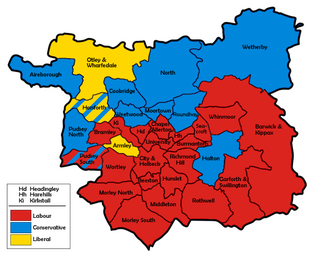
The 1980 Leeds City Council election took place on 1 May 1980 to elect members of Leeds City Council in England.
Elections to elect all members of the North West Leicestershire District Council took place on 7 May 2015, simultaneously with a general election, held as one of the English local elections of that year.
The 2015 South Oxfordshire District Council election was held on 7 May 2015 to elect members of South Oxfordshire District Council in England. This was on the same day as other local elections.
The City of Bradford Metropolitan District Council elections were held on Thursday, 4 May 1995, with one third of the council up for election. Prior to the election there had been a by-election in Tong after incumbent Labour councillor, Gerry Sutcliffe, was selected as their candidate for the Bradford South by-election, which Labour successfully defended. Labour retained control of the council.
City of Bradford Metropolitan District Council elections were held on Thursday, 2 May 1996, with one third of the council up for election. Labour retained control of the council.
Elections to City of Bradford Metropolitan District Council were held on 10 June 2004. The whole council was up for election following boundary changes. The council stayed under no overall control.
West Dorset District Council in Dorset, England existed from 1974 to 2019. The council was abolished and subsumed into Dorset Council in 2019.
The 2023 Derbyshire Dales District Council election was held on 4 May 2023 to elect all 34 councillors for Derbyshire Dales District Council. This was on the same day as other local elections.