US8538499B2 - Process and apparatus for non-invasive, continuous in vivo measurement of hematocrit - Google Patents
Process and apparatus for non-invasive, continuous in vivo measurement of hematocrit Download PDFInfo
- Publication number
- US8538499B2 US8538499B2 US12/889,396 US88939610A US8538499B2 US 8538499 B2 US8538499 B2 US 8538499B2 US 88939610 A US88939610 A US 88939610A US 8538499 B2 US8538499 B2 US 8538499B2
- Authority
- US
- United States
- Prior art keywords
- tissue
- light
- scattering
- volume
- plasma
- Prior art date
- Legal status (The legal status is an assumption and is not a legal conclusion. Google has not performed a legal analysis and makes no representation as to the accuracy of the status listed.)
- Active, expires
Links
- 238000000034 method Methods 0.000 title claims abstract description 72
- 238000005534 hematocrit Methods 0.000 title claims abstract description 52
- 230000008569 process Effects 0.000 title description 23
- 238000012623 in vivo measurement Methods 0.000 title 1
- 210000003743 erythrocyte Anatomy 0.000 claims abstract description 143
- 238000001727 in vivo Methods 0.000 claims abstract description 57
- 230000001678 irradiating effect Effects 0.000 claims abstract description 8
- 210000001519 tissue Anatomy 0.000 claims description 235
- 210000002381 plasma Anatomy 0.000 claims description 88
- 230000003068 static effect Effects 0.000 claims description 87
- 230000035488 systolic blood pressure Effects 0.000 claims description 13
- 230000035487 diastolic blood pressure Effects 0.000 claims description 11
- 230000000747 cardiac effect Effects 0.000 claims description 10
- 230000036962 time dependent Effects 0.000 claims description 8
- 210000003491 skin Anatomy 0.000 description 143
- 210000004369 blood Anatomy 0.000 description 104
- 239000008280 blood Substances 0.000 description 104
- 230000000694 effects Effects 0.000 description 55
- 238000004364 calculation method Methods 0.000 description 46
- 230000003287 optical effect Effects 0.000 description 45
- 230000005855 radiation Effects 0.000 description 43
- 238000005259 measurement Methods 0.000 description 40
- 230000008859 change Effects 0.000 description 36
- 238000001069 Raman spectroscopy Methods 0.000 description 33
- 238000002474 experimental method Methods 0.000 description 33
- 230000007423 decrease Effects 0.000 description 31
- 238000001444 catalytic combustion detection Methods 0.000 description 28
- 238000012360 testing method Methods 0.000 description 27
- 230000033001 locomotion Effects 0.000 description 25
- 238000010521 absorption reaction Methods 0.000 description 24
- XUMBMVFBXHLACL-UHFFFAOYSA-N Melanin Chemical compound O=C1C(=O)C(C2=CNC3=C(C(C(=O)C4=C32)=O)C)=C2C4=CNC2=C1C XUMBMVFBXHLACL-UHFFFAOYSA-N 0.000 description 22
- WQZGKKKJIJFFOK-GASJEMHNSA-N Glucose Natural products OC[C@H]1OC(O)[C@H](O)[C@@H](O)[C@@H]1O WQZGKKKJIJFFOK-GASJEMHNSA-N 0.000 description 21
- 239000008103 glucose Substances 0.000 description 21
- 239000000523 sample Substances 0.000 description 21
- 230000005284 excitation Effects 0.000 description 20
- 238000004061 bleaching Methods 0.000 description 18
- XLYOFNOQVPJJNP-UHFFFAOYSA-N water Substances O XLYOFNOQVPJJNP-UHFFFAOYSA-N 0.000 description 18
- 230000006399 behavior Effects 0.000 description 17
- 230000005540 biological transmission Effects 0.000 description 16
- 239000000463 material Substances 0.000 description 15
- 238000004422 calculation algorithm Methods 0.000 description 14
- 230000006870 function Effects 0.000 description 14
- 238000004519 manufacturing process Methods 0.000 description 14
- 108010054147 Hemoglobins Proteins 0.000 description 13
- 102000001554 Hemoglobins Human genes 0.000 description 13
- 238000011084 recovery Methods 0.000 description 13
- 230000002123 temporal effect Effects 0.000 description 13
- 238000013459 approach Methods 0.000 description 12
- 230000017531 blood circulation Effects 0.000 description 12
- 210000004180 plasmocyte Anatomy 0.000 description 12
- 238000001228 spectrum Methods 0.000 description 12
- 230000000875 corresponding effect Effects 0.000 description 10
- 239000012530 fluid Substances 0.000 description 10
- 238000000338 in vitro Methods 0.000 description 10
- 206010012601 diabetes mellitus Diseases 0.000 description 9
- 230000010355 oscillation Effects 0.000 description 9
- 238000001237 Raman spectrum Methods 0.000 description 8
- 238000006073 displacement reaction Methods 0.000 description 8
- 210000002615 epidermis Anatomy 0.000 description 8
- 230000002706 hydrostatic effect Effects 0.000 description 8
- 238000012544 monitoring process Methods 0.000 description 8
- 150000004032 porphyrins Chemical class 0.000 description 8
- 239000000126 substance Substances 0.000 description 8
- 229910000639 Spring steel Inorganic materials 0.000 description 7
- 230000000295 complement effect Effects 0.000 description 7
- 238000005286 illumination Methods 0.000 description 7
- 239000000203 mixture Substances 0.000 description 7
- 238000012876 topography Methods 0.000 description 7
- 238000012546 transfer Methods 0.000 description 7
- 208000032843 Hemorrhage Diseases 0.000 description 6
- KDXKERNSBIXSRK-YFKPBYRVSA-N L-lysine Chemical compound NCCCC[C@H](N)C(O)=O KDXKERNSBIXSRK-YFKPBYRVSA-N 0.000 description 6
- PYMYPHUHKUWMLA-LMVFSUKVSA-N Ribose Natural products OC[C@@H](O)[C@@H](O)[C@@H](O)C=O PYMYPHUHKUWMLA-LMVFSUKVSA-N 0.000 description 6
- 238000004458 analytical method Methods 0.000 description 6
- 238000006243 chemical reaction Methods 0.000 description 6
- 230000003247 decreasing effect Effects 0.000 description 6
- 210000004207 dermis Anatomy 0.000 description 6
- 238000001125 extrusion Methods 0.000 description 6
- 239000000835 fiber Substances 0.000 description 6
- 230000036252 glycation Effects 0.000 description 6
- 238000003825 pressing Methods 0.000 description 6
- 239000007787 solid Substances 0.000 description 6
- 230000003595 spectral effect Effects 0.000 description 6
- 108010005094 Advanced Glycation End Products Proteins 0.000 description 5
- HMFHBZSHGGEWLO-SOOFDHNKSA-N D-ribofuranose Chemical compound OC[C@H]1OC(O)[C@H](O)[C@@H]1O HMFHBZSHGGEWLO-SOOFDHNKSA-N 0.000 description 5
- 239000004472 Lysine Substances 0.000 description 5
- HMFHBZSHGGEWLO-UHFFFAOYSA-N alpha-D-Furanose-Ribose Natural products OCC1OC(O)C(O)C1O HMFHBZSHGGEWLO-UHFFFAOYSA-N 0.000 description 5
- 210000004027 cell Anatomy 0.000 description 5
- 239000000470 constituent Substances 0.000 description 5
- 210000000245 forearm Anatomy 0.000 description 5
- 238000010606 normalization Methods 0.000 description 5
- 238000006862 quantum yield reaction Methods 0.000 description 5
- 239000000243 solution Substances 0.000 description 5
- 210000000434 stratum corneum Anatomy 0.000 description 5
- 239000004475 Arginine Substances 0.000 description 4
- ODKSFYDXXFIFQN-BYPYZUCNSA-P L-argininium(2+) Chemical compound NC(=[NH2+])NCCC[C@H]([NH3+])C(O)=O ODKSFYDXXFIFQN-BYPYZUCNSA-P 0.000 description 4
- KDXKERNSBIXSRK-UHFFFAOYSA-N Lysine Natural products NCCCCC(N)C(O)=O KDXKERNSBIXSRK-UHFFFAOYSA-N 0.000 description 4
- ODKSFYDXXFIFQN-UHFFFAOYSA-N arginine Natural products OC(=O)C(N)CCCNC(N)=N ODKSFYDXXFIFQN-UHFFFAOYSA-N 0.000 description 4
- 235000009697 arginine Nutrition 0.000 description 4
- 230000036772 blood pressure Effects 0.000 description 4
- 238000010586 diagram Methods 0.000 description 4
- 230000002500 effect on skin Effects 0.000 description 4
- 230000003993 interaction Effects 0.000 description 4
- 235000018977 lysine Nutrition 0.000 description 4
- 230000000873 masking effect Effects 0.000 description 4
- 239000002184 metal Substances 0.000 description 4
- 229910052751 metal Inorganic materials 0.000 description 4
- 238000012821 model calculation Methods 0.000 description 4
- 238000002095 near-infrared Raman spectroscopy Methods 0.000 description 4
- 230000002829 reductive effect Effects 0.000 description 4
- 230000004044 response Effects 0.000 description 4
- 238000007920 subcutaneous administration Methods 0.000 description 4
- 238000002834 transmittance Methods 0.000 description 4
- 238000012935 Averaging Methods 0.000 description 3
- 210000003484 anatomy Anatomy 0.000 description 3
- 230000002238 attenuated effect Effects 0.000 description 3
- 238000004159 blood analysis Methods 0.000 description 3
- 210000000172 cytosol Anatomy 0.000 description 3
- 238000001514 detection method Methods 0.000 description 3
- 238000009826 distribution Methods 0.000 description 3
- 230000013632 homeostatic process Effects 0.000 description 3
- 238000012886 linear function Methods 0.000 description 3
- 230000035515 penetration Effects 0.000 description 3
- 239000000047 product Substances 0.000 description 3
- 235000018102 proteins Nutrition 0.000 description 3
- 102000004169 proteins and genes Human genes 0.000 description 3
- 108090000623 proteins and genes Proteins 0.000 description 3
- 241000894007 species Species 0.000 description 3
- 238000004611 spectroscopical analysis Methods 0.000 description 3
- 229910001220 stainless steel Inorganic materials 0.000 description 3
- 239000010935 stainless steel Substances 0.000 description 3
- 239000011800 void material Substances 0.000 description 3
- CIWBSHSKHKDKBQ-JLAZNSOCSA-N Ascorbic acid Chemical compound OC[C@H](O)[C@H]1OC(=O)C(O)=C1O CIWBSHSKHKDKBQ-JLAZNSOCSA-N 0.000 description 2
- 102000008186 Collagen Human genes 0.000 description 2
- 108010035532 Collagen Proteins 0.000 description 2
- 229920004943 Delrin® Polymers 0.000 description 2
- MYMOFIZGZYHOMD-UHFFFAOYSA-N Dioxygen Chemical compound O=O MYMOFIZGZYHOMD-UHFFFAOYSA-N 0.000 description 2
- 108010010803 Gelatin Proteins 0.000 description 2
- 238000012404 In vitro experiment Methods 0.000 description 2
- 229910000831 Steel Inorganic materials 0.000 description 2
- 150000001408 amides Chemical class 0.000 description 2
- 239000002585 base Substances 0.000 description 2
- 238000004820 blood count Methods 0.000 description 2
- 229920001436 collagen Polymers 0.000 description 2
- 150000001875 compounds Chemical class 0.000 description 2
- 238000001816 cooling Methods 0.000 description 2
- 238000012937 correction Methods 0.000 description 2
- 230000002596 correlated effect Effects 0.000 description 2
- 238000010790 dilution Methods 0.000 description 2
- 239000012895 dilution Substances 0.000 description 2
- 230000005670 electromagnetic radiation Effects 0.000 description 2
- 238000005516 engineering process Methods 0.000 description 2
- 210000003722 extracellular fluid Anatomy 0.000 description 2
- 230000002349 favourable effect Effects 0.000 description 2
- 238000001506 fluorescence spectroscopy Methods 0.000 description 2
- 229920000159 gelatin Polymers 0.000 description 2
- 239000008273 gelatin Substances 0.000 description 2
- 235000019322 gelatine Nutrition 0.000 description 2
- 235000011852 gelatine desserts Nutrition 0.000 description 2
- 238000009499 grossing Methods 0.000 description 2
- 230000036571 hydration Effects 0.000 description 2
- 238000006703 hydration reaction Methods 0.000 description 2
- 230000010354 integration Effects 0.000 description 2
- 230000003834 intracellular effect Effects 0.000 description 2
- 238000012423 maintenance Methods 0.000 description 2
- 230000004089 microcirculation Effects 0.000 description 2
- 238000013508 migration Methods 0.000 description 2
- 230000005012 migration Effects 0.000 description 2
- 230000003278 mimic effect Effects 0.000 description 2
- 239000013307 optical fiber Substances 0.000 description 2
- 238000012634 optical imaging Methods 0.000 description 2
- 230000010412 perfusion Effects 0.000 description 2
- 230000010287 polarization Effects 0.000 description 2
- 230000000644 propagated effect Effects 0.000 description 2
- 230000033764 rhythmic process Effects 0.000 description 2
- 230000036555 skin type Effects 0.000 description 2
- 239000010959 steel Substances 0.000 description 2
- 238000011282 treatment Methods 0.000 description 2
- 230000024883 vasodilation Effects 0.000 description 2
- 230000002861 ventricular Effects 0.000 description 2
- 230000000007 visual effect Effects 0.000 description 2
- -1 β-Carotene Cyclohexane Chemical compound 0.000 description 2
- 241000894006 Bacteria Species 0.000 description 1
- BVKZGUZCCUSVTD-UHFFFAOYSA-M Bicarbonate Chemical compound OC([O-])=O BVKZGUZCCUSVTD-UHFFFAOYSA-M 0.000 description 1
- 241000219104 Cucurbitaceae Species 0.000 description 1
- XDTMQSROBMDMFD-UHFFFAOYSA-N Cyclohexane Chemical compound C1CCCCC1 XDTMQSROBMDMFD-UHFFFAOYSA-N 0.000 description 1
- 102000018832 Cytochromes Human genes 0.000 description 1
- 108010052832 Cytochromes Proteins 0.000 description 1
- 102000004190 Enzymes Human genes 0.000 description 1
- 108090000790 Enzymes Proteins 0.000 description 1
- 108010037362 Extracellular Matrix Proteins Proteins 0.000 description 1
- 102000010834 Extracellular Matrix Proteins Human genes 0.000 description 1
- 208000032456 Hemorrhagic Shock Diseases 0.000 description 1
- 241000282412 Homo Species 0.000 description 1
- RWSXRVCMGQZWBV-PHDIDXHHSA-N L-Glutathione Natural products OC(=O)[C@H](N)CCC(=O)N[C@H](CS)C(=O)NCC(O)=O RWSXRVCMGQZWBV-PHDIDXHHSA-N 0.000 description 1
- 235000019766 L-Lysine Nutrition 0.000 description 1
- ODKSFYDXXFIFQN-BYPYZUCNSA-N L-arginine Chemical compound OC(=O)[C@@H](N)CCCN=C(N)N ODKSFYDXXFIFQN-BYPYZUCNSA-N 0.000 description 1
- 229930064664 L-arginine Natural products 0.000 description 1
- 235000014852 L-arginine Nutrition 0.000 description 1
- 239000002211 L-ascorbic acid Substances 0.000 description 1
- 235000000069 L-ascorbic acid Nutrition 0.000 description 1
- UPYKUZBSLRQECL-UKMVMLAPSA-N Lycopene Natural products CC(=C/C=C/C=C(C)/C=C/C=C(C)/C=C/C1C(=C)CCCC1(C)C)C=CC=C(/C)C=CC2C(=C)CCCC2(C)C UPYKUZBSLRQECL-UKMVMLAPSA-N 0.000 description 1
- 108010061951 Methemoglobin Proteins 0.000 description 1
- 235000006508 Nelumbo nucifera Nutrition 0.000 description 1
- 235000006510 Nelumbo pentapetala Nutrition 0.000 description 1
- 229910019142 PO4 Inorganic materials 0.000 description 1
- 241000282376 Panthera tigris Species 0.000 description 1
- 241001363516 Plusia festucae Species 0.000 description 1
- 241000288906 Primates Species 0.000 description 1
- 206010049771 Shock haemorrhagic Diseases 0.000 description 1
- VYPSYNLAJGMNEJ-UHFFFAOYSA-N Silicium dioxide Chemical compound O=[Si]=O VYPSYNLAJGMNEJ-UHFFFAOYSA-N 0.000 description 1
- 239000004809 Teflon Substances 0.000 description 1
- 229920006362 Teflon® Polymers 0.000 description 1
- 206010044565 Tremor Diseases 0.000 description 1
- LEHOTFFKMJEONL-UHFFFAOYSA-N Uric Acid Chemical compound N1C(=O)NC(=O)C2=C1NC(=O)N2 LEHOTFFKMJEONL-UHFFFAOYSA-N 0.000 description 1
- TVWHNULVHGKJHS-UHFFFAOYSA-N Uric acid Natural products N1C(=O)NC(=O)C2NC(=O)NC21 TVWHNULVHGKJHS-UHFFFAOYSA-N 0.000 description 1
- 206010047139 Vasoconstriction Diseases 0.000 description 1
- 241000251539 Vertebrata <Metazoa> Species 0.000 description 1
- QYSXJUFSXHHAJI-XFEUOLMDSA-N Vitamin D3 Natural products C1(/[C@@H]2CC[C@@H]([C@]2(CCC1)C)[C@H](C)CCCC(C)C)=C/C=C1\C[C@@H](O)CCC1=C QYSXJUFSXHHAJI-XFEUOLMDSA-N 0.000 description 1
- 230000006978 adaptation Effects 0.000 description 1
- 239000003963 antioxidant agent Substances 0.000 description 1
- 235000006708 antioxidants Nutrition 0.000 description 1
- 238000000149 argon plasma sintering Methods 0.000 description 1
- 229960005070 ascorbic acid Drugs 0.000 description 1
- 230000002567 autonomic effect Effects 0.000 description 1
- 230000008901 benefit Effects 0.000 description 1
- 230000008033 biological extinction Effects 0.000 description 1
- 230000015572 biosynthetic process Effects 0.000 description 1
- 239000007844 bleaching agent Substances 0.000 description 1
- 230000000740 bleeding effect Effects 0.000 description 1
- 210000000988 bone and bone Anatomy 0.000 description 1
- 210000004556 brain Anatomy 0.000 description 1
- 210000000481 breast Anatomy 0.000 description 1
- 239000008366 buffered solution Substances 0.000 description 1
- 150000001720 carbohydrates Chemical class 0.000 description 1
- 235000014633 carbohydrates Nutrition 0.000 description 1
- 235000005473 carotenes Nutrition 0.000 description 1
- 150000001746 carotenes Chemical class 0.000 description 1
- 239000007806 chemical reaction intermediate Substances 0.000 description 1
- 239000013626 chemical specie Substances 0.000 description 1
- 230000004087 circulation Effects 0.000 description 1
- 230000001447 compensatory effect Effects 0.000 description 1
- 230000008878 coupling Effects 0.000 description 1
- 238000010168 coupling process Methods 0.000 description 1
- 238000005859 coupling reaction Methods 0.000 description 1
- GVJHHUAWPYXKBD-UHFFFAOYSA-N d-alpha-tocopherol Natural products OC1=C(C)C(C)=C2OC(CCCC(C)CCCC(C)CCCC(C)C)(C)CCC2=C1C GVJHHUAWPYXKBD-UHFFFAOYSA-N 0.000 description 1
- 238000013480 data collection Methods 0.000 description 1
- 239000008367 deionised water Substances 0.000 description 1
- 229910021641 deionized water Inorganic materials 0.000 description 1
- 230000001419 dependent effect Effects 0.000 description 1
- 238000011161 development Methods 0.000 description 1
- 239000006185 dispersion Substances 0.000 description 1
- 210000000624 ear auricle Anatomy 0.000 description 1
- 238000000295 emission spectrum Methods 0.000 description 1
- 210000002744 extracellular matrix Anatomy 0.000 description 1
- 210000003414 extremity Anatomy 0.000 description 1
- 238000001914 filtration Methods 0.000 description 1
- 210000004905 finger nail Anatomy 0.000 description 1
- 210000004904 fingernail bed Anatomy 0.000 description 1
- 230000004907 flux Effects 0.000 description 1
- 239000012458 free base Substances 0.000 description 1
- 239000005350 fused silica glass Substances 0.000 description 1
- RWSXRVCMGQZWBV-WDSKDSINSA-N glutathione Chemical compound OC(=O)[C@@H](N)CCC(=O)N[C@@H](CS)C(=O)NCC(O)=O RWSXRVCMGQZWBV-WDSKDSINSA-N 0.000 description 1
- 230000034659 glycolysis Effects 0.000 description 1
- PCHJSUWPFVWCPO-UHFFFAOYSA-N gold Chemical compound [Au] PCHJSUWPFVWCPO-UHFFFAOYSA-N 0.000 description 1
- 239000010931 gold Substances 0.000 description 1
- 229910052737 gold Inorganic materials 0.000 description 1
- 230000001121 heart beat frequency Effects 0.000 description 1
- 150000002402 hexoses Chemical class 0.000 description 1
- 230000003284 homeostatic effect Effects 0.000 description 1
- 238000003384 imaging method Methods 0.000 description 1
- 239000012535 impurity Substances 0.000 description 1
- 238000010348 incorporation Methods 0.000 description 1
- 238000011534 incubation Methods 0.000 description 1
- 208000014674 injury Diseases 0.000 description 1
- 238000011835 investigation Methods 0.000 description 1
- 238000005304 joining Methods 0.000 description 1
- 210000002510 keratinocyte Anatomy 0.000 description 1
- 210000000265 leukocyte Anatomy 0.000 description 1
- 239000007788 liquid Substances 0.000 description 1
- 230000007774 longterm Effects 0.000 description 1
- 210000002752 melanocyte Anatomy 0.000 description 1
- 238000000386 microscopy Methods 0.000 description 1
- 238000002156 mixing Methods 0.000 description 1
- 210000003205 muscle Anatomy 0.000 description 1
- HFAYQHIHIBTMBI-UHFFFAOYSA-N n-(3,5-dimethylphenyl)acetamide Chemical compound CC(=O)NC1=CC(C)=CC(C)=C1 HFAYQHIHIBTMBI-UHFFFAOYSA-N 0.000 description 1
- 210000000282 nail Anatomy 0.000 description 1
- 230000007935 neutral effect Effects 0.000 description 1
- 238000001208 nuclear magnetic resonance pulse sequence Methods 0.000 description 1
- 210000000056 organ Anatomy 0.000 description 1
- 230000003647 oxidation Effects 0.000 description 1
- 238000007254 oxidation reaction Methods 0.000 description 1
- 206010033675 panniculitis Diseases 0.000 description 1
- 150000002972 pentoses Chemical class 0.000 description 1
- 230000000737 periodic effect Effects 0.000 description 1
- 239000010452 phosphate Substances 0.000 description 1
- 230000035479 physiological effects, processes and functions Effects 0.000 description 1
- 230000036544 posture Effects 0.000 description 1
- 238000002106 pulse oximetry Methods 0.000 description 1
- 230000005610 quantum mechanics Effects 0.000 description 1
- 238000012892 rational function Methods 0.000 description 1
- 239000011541 reaction mixture Substances 0.000 description 1
- 238000000985 reflectance spectrum Methods 0.000 description 1
- 238000011160 research Methods 0.000 description 1
- 230000029058 respiratory gaseous exchange Effects 0.000 description 1
- 229920006395 saturated elastomer Polymers 0.000 description 1
- 239000012047 saturated solution Substances 0.000 description 1
- 238000012216 screening Methods 0.000 description 1
- 238000000926 separation method Methods 0.000 description 1
- 238000004088 simulation Methods 0.000 description 1
- 210000004872 soft tissue Anatomy 0.000 description 1
- 239000002904 solvent Substances 0.000 description 1
- 238000010183 spectrum analysis Methods 0.000 description 1
- 230000002269 spontaneous effect Effects 0.000 description 1
- 235000020354 squash Nutrition 0.000 description 1
- 239000011550 stock solution Substances 0.000 description 1
- 238000003860 storage Methods 0.000 description 1
- 210000004304 subcutaneous tissue Anatomy 0.000 description 1
- 235000000346 sugar Nutrition 0.000 description 1
- 150000008163 sugars Chemical class 0.000 description 1
- 238000001356 surgical procedure Methods 0.000 description 1
- 230000028016 temperature homeostasis Effects 0.000 description 1
- 229960001295 tocopherol Drugs 0.000 description 1
- 229930003799 tocopherol Natural products 0.000 description 1
- 235000010384 tocopherol Nutrition 0.000 description 1
- 239000011732 tocopherol Substances 0.000 description 1
- 230000001052 transient effect Effects 0.000 description 1
- 230000007704 transition Effects 0.000 description 1
- 230000008733 trauma Effects 0.000 description 1
- 230000000472 traumatic effect Effects 0.000 description 1
- 238000011269 treatment regimen Methods 0.000 description 1
- 229940116269 uric acid Drugs 0.000 description 1
- 230000002792 vascular Effects 0.000 description 1
- 230000025033 vasoconstriction Effects 0.000 description 1
- 210000003462 vein Anatomy 0.000 description 1
- 238000002460 vibrational spectroscopy Methods 0.000 description 1
- 238000001845 vibrational spectrum Methods 0.000 description 1
- 229940088594 vitamin Drugs 0.000 description 1
- 239000011782 vitamin Substances 0.000 description 1
- 229930003231 vitamin Natural products 0.000 description 1
- 235000013343 vitamin Nutrition 0.000 description 1
- NCYCYZXNIZJOKI-UHFFFAOYSA-N vitamin A aldehyde Natural products O=CC=C(C)C=CC=C(C)C=CC1=C(C)CCCC1(C)C NCYCYZXNIZJOKI-UHFFFAOYSA-N 0.000 description 1
- QYSXJUFSXHHAJI-YRZJJWOYSA-N vitamin D3 Chemical compound C1(/[C@@H]2CC[C@@H]([C@]2(CCC1)C)[C@H](C)CCCC(C)C)=C\C=C1\C[C@@H](O)CCC1=C QYSXJUFSXHHAJI-YRZJJWOYSA-N 0.000 description 1
- 235000005282 vitamin D3 Nutrition 0.000 description 1
- 239000011647 vitamin D3 Substances 0.000 description 1
- 229940021056 vitamin d3 Drugs 0.000 description 1
- 238000010792 warming Methods 0.000 description 1
- GVJHHUAWPYXKBD-IEOSBIPESA-N α-tocopherol Chemical compound OC1=C(C)C(C)=C2O[C@@](CCC[C@H](C)CCC[C@H](C)CCCC(C)C)(C)CCC2=C1C GVJHHUAWPYXKBD-IEOSBIPESA-N 0.000 description 1
Images


Classifications
-
- A—HUMAN NECESSITIES
- A61—MEDICAL OR VETERINARY SCIENCE; HYGIENE
- A61B—DIAGNOSIS; SURGERY; IDENTIFICATION
- A61B5/00—Measuring for diagnostic purposes; Identification of persons
- A61B5/145—Measuring characteristics of blood in vivo, e.g. gas concentration or pH-value ; Measuring characteristics of body fluids or tissues, e.g. interstitial fluid or cerebral tissue
- A61B5/1455—Measuring characteristics of blood in vivo, e.g. gas concentration or pH-value ; Measuring characteristics of body fluids or tissues, e.g. interstitial fluid or cerebral tissue using optical sensors, e.g. spectral photometrical oximeters
-
- A—HUMAN NECESSITIES
- A61—MEDICAL OR VETERINARY SCIENCE; HYGIENE
- A61B—DIAGNOSIS; SURGERY; IDENTIFICATION
- A61B5/00—Measuring for diagnostic purposes; Identification of persons
- A61B5/145—Measuring characteristics of blood in vivo, e.g. gas concentration or pH-value ; Measuring characteristics of body fluids or tissues, e.g. interstitial fluid or cerebral tissue
- A61B5/14535—Measuring characteristics of blood in vivo, e.g. gas concentration or pH-value ; Measuring characteristics of body fluids or tissues, e.g. interstitial fluid or cerebral tissue for measuring haematocrit
-
- A—HUMAN NECESSITIES
- A61—MEDICAL OR VETERINARY SCIENCE; HYGIENE
- A61B—DIAGNOSIS; SURGERY; IDENTIFICATION
- A61B5/00—Measuring for diagnostic purposes; Identification of persons
- A61B5/145—Measuring characteristics of blood in vivo, e.g. gas concentration or pH-value ; Measuring characteristics of body fluids or tissues, e.g. interstitial fluid or cerebral tissue
- A61B5/14532—Measuring characteristics of blood in vivo, e.g. gas concentration or pH-value ; Measuring characteristics of body fluids or tissues, e.g. interstitial fluid or cerebral tissue for measuring glucose, e.g. by tissue impedance measurement
Definitions
- This invention teaches a noninvasive method and apparatus for obtaining a continuous time record of relative blood hematocrit, particularly in humans.
- the invention provides a method of obtaining a hematocrit from a sample of in vivo tissue.
- the method comprises irradiating the sample with a single incident wavelength on a sample of tissue, and simultaneously measuring wavelength shifted (IE) and unshifted (EE) light emitted from the tissue.
- the method further comprises determining a relative volume of light emitted from two phases, wherein the two phases comprise a first Rayleigh and Mie scattering and fluorescent phase associated with red blood cells, and a second, non-scattering phase associated with plasma.
- the hematocrit is calculated from the volume of light emitted by the first phase relative to the total volume of light emitted from the first and second phases.
- the incident wavelength is 580-2500 nm. In some embodiments, the incident wavelength is 785, 805 or 830 nm.
- the measuring is typically at 500-1800 cm ⁇ 1 for shifted light, and at ⁇ 30-+10 cm ⁇ 1 for unshifted light.
- the determining comprises calculating the hematocrit as:
- EE/EE 0 and IE/IE 0 can be obtained by quantitative estimation using, for example, ventricular ejection volume averaged over entire circulation volume.
- the values are estimated using the modulated spectra obtained during a blood depleted state in the tissue and spectra obtained in a blood replete state.
- Another example of determining parameters from empirical comparisons is the ventricular ejection volume example, wherein with each cardiac pulse ⁇ 75 ml of homeostatic hematocrit blood is ejected into the ⁇ 4000 ml total supply.
- This ⁇ 1.9% transient increase in blood volume i.e. for both ⁇ r and ⁇ p , constitutes the pressure wave of the pulse, and corresponds a 2.626% and ⁇ 2.08% change in EE and IE, respectively, with each cardiac driven pulse, i.e. systoli EE and IE minus diastoli EE and IE.
- These two conditions can be inserted into [8] and [9] to generate two constraints on the values of the parameters a-f.
- tissue is a fingertip and other tissues involving similar parameters.
- a test subject fingertip was tissue modulated between 83 g-force/cm 2 and 276 g-force/cm 2 , and the IE increased by 3.03% and the EE decreased by 9.6%.
- ⁇ r tissue modulated between 83 g-force/cm 2 and 276 g-force/cm 2
- the IE increased by 3.03%
- the EE decreased by 9.6%.
- IE and EE can be calculated using [6] and [7] and this can be inverted numerically to produce the two equations of the form of [8] and [9] and simultaneously the parameters a through f needed to calculate the and ⁇ r and ⁇ p .
- Many available spread sheet programs e.g. the Solver in Microsoft ExcelTM, can be used to do this calculation and then vary any two parameters, e.g. c and f, subject to the four constraints just given, so as to minimize the standard deviation of the hematocrit over a time series.
- c and f needed to initialize the nonlinear least squares routine is not particularly important so, as a practical matter, they can be chosen initially to be equal to any of the other parameters. Regardless of the exact choice, the least squares routine converges to the same quantitative result for c and f. Furthermore, the Hct value consistent with the initial choice of ⁇ r and ⁇ p is maintained until or unless the EE and IE start to deviate from the reference values.
- a full set of optimized parameters so obtained can be used later for the same person or different people to monitor any changes of the hematocrit in time.
- the tissue modulation process can be used to produce different and reproducible phase fractions for purposes of generating unusual distributions of the phases and the corresponding EE and IE data to input into the calibration process just described.
- pressing harder than the systolic pressure for several seconds is effective.
- the tissue is human. Other species, particularly primates and other vertebrates, can also be subjects for whom the method is useful.
- the tissue is a fingertip, although those skilled in the art will appreciate the applicability of the method to other areas of the body, including forearm and ear lobe, for example.
- the fingertip is pressed against an aperture of an apparatus that emits light directed at the fingertip through the aperture.
- the pressure at which the fingertip is initially pressed is approximately the average of the prevailing systolic and diastolic blood pressures of the subject.
- the EE and IE can be the AC components of the time dependent EE and IE signals, for example, in the bandpass of 2.5 Hz to 0.25 Hz.
- the method EE and IE can alternatively be the DC components of the time dependent EE and IE signals, e.g., in the bandpass of 0 ⁇ 10 Hz.
- the invention additionally provides an apparatus for obtaining a hematocrit from a sample of tissue.
- the apparatus comprises a means for irradiating the sample with a single incident wavelength on a sample of tissue; a means for simultaneously measuring wavelength shifted and unshifted light emitted from the tissue; and means for determining a relative volume of light emitted from two phases, wherein the two phases comprise a first predominantly Rayleigh and Mie scattering and fluorescent phase associated with red blood cells, and a second, non-scattering phase associated with plasma.
- the apparatus also includes means for calculating a volume fraction of red blood cells relative to the total volume of red blood cells and plasma.
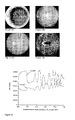
- FIGS. 1A-1B depict a typical set of CCD frames integrated to show how the total wavelength shifted remitted light (IE) varies in time relative to the elastically scattered light (EE).
- the raw IE and EE are obtained by integrating 20 msec CCD frames over Raman shift, i.e. 650 cm ⁇ 1 to 1800 cm ⁇ 1 for IE, and between ⁇ 10 cm ⁇ 1 and +10 cm ⁇ 1 for EE.
- FIGS. 1A and 1B both show same data, but at different temporal resolution.
- FIG. 2 depicts calculated volume fractions for RBCs and plasma using data in FIG. 1 and equations [8] and [9], and 51 pt adjacent averaged data as reference IE 0 and EE 0 levels.
- FIG. 3 depicts the same calculation results as FIG. 2 , but showing data on same timescale as FIG. 1B .
- the RBC fraction is multiplied by 10 nearly accounting for the Hct value, to facilitate visual comparison of the time dependence of the two fractions. Note that the volume fractions are nearly coincident in time.
- FIG. 4 depicts the calculated Hct value using volume fractions in FIGS. 2 and 3 .
- FIG. 5 shows IE and EE as a function time for two different modulation cycles.
- the pressure went from 60 g-force/cm 2 to 200 g-force/cm 2 and in the other the opposite is true.
- the black and blue are one pair and the red and green are another. The black and blue sequence was used to provide the calibration in the text.
- FIG. 6 is an image of a computer display screen depicting a series of tissue modulated difference spectra showing the effect of monotonically increasing the pressure in the pressed stage so as to produce different discharge hematocrit in each case for use in the calibration procedure.
- tissue modulated difference spectra showing the effect of monotonically increasing the pressure in the pressed stage so as to produce different discharge hematocrit in each case for use in the calibration procedure.
- FIG. 7 is calculated Hct and phase volume fractions for data in FIG. 1 using procedure outlined in text and modulation results in FIGS. 6 and 7 to estimate parameters.
- FIG. 8 calculated Hct for data 64.5 ⁇ time ⁇ 91.5 sec in FIG. 1 using all the same parameters obtained for 56 ⁇ time ⁇ 64 sec.
- FIG. 9 shows intensity (in counts) versus frequency; in the upper portion: raw typical single 20 msec frame of Andor ccd output with system optimally aligned using 200 mW of 830 nm excitation.
- sections of emission used to calculate IE ⁇ 500-1750 cm ⁇ 1
- EE ⁇ 30-+10 cm ⁇ 1
- the sections used to calculate inelastic scattering intensity IE ⁇ 50 ⁇ tilde over (0) ⁇ 1750 cm ⁇ 1
- elastic scattering intensity EE ⁇ 3 ⁇ tilde over (0) ⁇ +10 cm ⁇ 1
- the low shift integration limit for obtaining IE was chosen by reference to the output obtained when the sample is a non-fluorescent metal and requiring that no EE is included in the IR integral.
- IE integrated total inelastic scattered light+fluorescence
- EE integrated total elastic scattered light
- FIG. 11 depicts the calculated scattering length of 830 nm radiation in medium having total blood volume of 3-5% and hematocrit shown on abscissa, with remainder of volume filled with epidermis. Scattering coefficients are taken from Tuchin, 2007, Tissue Optics , SPIE Press, Bellingham, Wash.; and Zhang et al., 2005, J. Biomed. Optics, 10, 024030.
- FIGS. 12A-12D are images taken through the aperture of an apparatus of the invention.
- FIG. 12A depicts a backlit flat DelrinTM block
- FIG. 12B shows an unpressed fingertip (pressure ⁇ 45 g/cm 2 ), showing illumination at center
- FIG. 12C shows a fingertip pressed hard (pressure>140 g/cm 2 ), showing displacement of illuminated area
- FIG. 12D shows the difference between the images of pressed ( 12 C) and unpressed ( 12 B) fingertips.
- FIG. 13 is a shows raw counts versus displacement steps for EE (elastic) and IE (inelastic) scattered light integrals from scan of laser and detector across fingerprint ridges plotted against displacement of fingertip alone across a stationary aperture.
- FIG. 14 shows elastic and inelastic scattering integrals (EE and IE) for four human subjects, plotted vs. displacement of the fingertip and aperture relative to the laser beam and the detector (fingertip stationary with respect to the aperture, laser beam stationary with respect to detector). Also shown are the EE and IE for a flat DelrinTM sheet and for a blank (no sample).
- the calculated EE includes specularly reflected light that increases when the reflected beam scans across the aperture with changing x s .
- the calculated IE is the EE result without the a specular reflection contribution. Results of calculations described in the text are indicated by thick black lines joining black squares.
- the positions of the laser entrance point at the different times of a tissue modulation sequence are shown at U, C, and P, as described in the Example.
- FIG. 15 depicts the geometry of the experiment: radiation is incident on the skin, modeled as three planar layers.
- the incident beam makes an angle ⁇ ′ with the outward normal, which is changed to ⁇ inside the skin by Snell's-Law refraction.
- FIG. 16B provides the top view, showing the projection of the collection circle in a plane perpendicular to PC.
- FIG. 17 shows collected intensities as a function of angle between incoming beam and external normal, with distance between beam center and center of collection circle fixed at 100 ⁇ .
- ⁇ static tissue
- ⁇ red blood cells
- ⁇ plasma.
- FIG. 18 shows modulated (difference between unpressed and pressed) total intensities plotted against the angle ⁇ ′, with distance between center of beam and center of detector circle fixed at 200 ⁇ .
- the curve in the figure is a cubic fit, for clarity.
- the optimum value of ⁇ ′ is 56.5°.
- FIG. 19 shows scattering intensities entering collection circle for static tissue (filled triangles), red blood cells (filled circles) and plasma (empty squares), plotted against ⁇ rb .
- Collected intensities for static tissue and for plasma decrease linearly with ⁇ rb .
- Panels A, B and C show scattered intensity from static tissue, red blood cells, and plasma. The empty squares in Panel A give the calculated intensity of specularly reflected light and the x's give the sum of the specular reflected light and the calculated intensity.
- FIG. 22A is a profile representing fingertip ridges: double-Gaussian functions with spacing 600 ⁇ , width 450 ⁇ , shape 30 ⁇ , and alternating heights of 120 ⁇ , and 60 ⁇ .
- FIG. 22B Calculated transmission coefficient averaged over width of beam (/ and error bars) plotted against starting x-value for center of beam above profile (left scale), superposed on the profile.
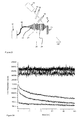
- FIG. 23 is a schematic diagram of an in-vivo LighTouch® measurement device optical layout.
- Incident light 10 emitted by the laser 12 passes through a clean-up filter 14 and plano-convex focusing lens 16 through an aperture in a steel sheet 18 against which the fingertip 20 to be probed is positioned.
- Collected light 22 passes through a compound collection lens 24 , “razor edge” filter 26 , and a refocusing lens 28 , to a fiber optic bundle 30 that leads to the spectrograph 32 .
- FIG. 24 shows results of photobleaching and hydrostatic relaxation study.
- Condition A) initial 100 s w/exposure and hydrostatic relaxation; B) second consecutive 100 s w/exposure and hydrostatic relaxation; C) 100 s w/exposure and hydrostatic relaxation following initial 100 s hydrostatic relaxation only, i.e. no laser exposure.
- FIG. 25 illustrates a linear fit of averaged decay constants vs. laser powers from 12 data points of two individuals.
- the applied pressure for an individual was the average of his diastolic and systolic blood pressure regardless of which fingertip was tested.
- FIG. 26 shows an in-vivo IE profile of a human fingertip, attempting to observe fluorescence recovery by allowing blood to flow into previously probed volume but with laser blocked. If all fluorescence observed at beginning of laser exposure were recoverable due to new blood flowing into probed volume without pervious laser exposure, the fluorescence should return to original value.
- FIG. 27 is an IE profile of two individual in-vivo fingertip scans performed on the same subject without moving hand out in between.
- the second scan (dotted line) is performed after 50 s bleaching under 200 mW laser exposure at the end of the first scan (solid line).
- FIG. 28A is a fluorescence profile of in-vitro hemoglobin solution (4.5 g/dL) under 450 mW 785 nm laser exposure. The sample is left in darkness without extra laser exposure for 1.5 hrs for recovery before the collection of the second series of data.
- FIG. 28B is a fluorescence profile of in-vitro melanin solution after 200 nm syringe filtration under 450 mW 785 nm laser exposure.
- the second profile (round dots) is collected after leaving the sample in dark for 2 hrs to recover if there is any. Similar experiments but allowing more than 12 his overnight recovery show comparable results.
- FIG. 29 is a plot of total fluorescence yield across 400-1900 cm ⁇ 1 Raman shift range for Maillard reaction product at various time points (0 min, 20 min, 40 min, 60 min, and 80 min respectively) along the course.
- the invention is based on the development of an algorithm that gives the ratio of the volume of the red blood cells to that of the plasma, allowing direct calculation of hematocrit.
- a single color of light is incident on vascularized tissue containing phases for which the absorption and scattering coefficients are known, e.g. plasma, red blood cells and static tissue.
- the elastically emitted (EE) light, with wavelength equal to incident wavelength, and the inelastically produced light, (IE), the wavelength shifted light, are collected simultaneously. These two measurements of light originate from orthogonal processes such that they can be combined using the algorithm.
- the method of the invention is advantageous in numerous respects. It is not necessary to separate Raman from fluorescent emissions, as one might expect from other spectral analysis systems.
- the method of the invention does not require use of a spectrograph, as it can be carried out using filters.
- the method can be practiced anywhere on the body. The method can be performed using fiber optics, allowing one to bring the measurement system to the relevant body part. It allows for the detection of internal hemorrhage without exploratory surgery, as well as monitoring of blood flow in the extremities, making it relevant to a wide range of medical conditions and assessments.
- the invention provides a method of using a single incident wavelength on a sample of tissue, in vivo or in vitro, and simultaneously measuring the wavelength shifted and unshifted light that is emitted from the tissue, in order to simultaneously estimate the relative volume of two phases, a predominantly scattering phase (associated with red blood cells) and another phase (associated with plasma), existing in the same probed volume.
- a predominantly scattering phase associated with red blood cells
- another phase associated with plasma
- Modulation of tissue to vary blood content occurs via the natural pulse of blood flow or can be effected through application of pressure to create blood depleted and blood replete states in the tissue.
- hematocrit Ht, Hct or HCT
- PCV packed cell volume
- EVF erythrocyte volume fraction
- phase refers to materials that occupy volume in the tissue, such as plasma, red blood cells, static tissues.
- Mie limit refers to electromagnetic radiation interacting with materials having a characteristic size about equal to the wavelength of the electromagnetic radiation. Mie limit scattering typically occurs in the presence of scattering bodies that are approximately 50% of the size of an incident laser wavelength.
- the “RTE” refers to the radiative transfer equation, which mathematically models the transfer of energy as photons move inside a tissue.
- the flow of radiation energy through a small area element in the radiation field can be characterized by radiance.
- the RTE is a differential equation describing radiance, defined as energy flow per unit normal area per unit solid angle per unit time. It can be derived via conservation of energy. Briefly, the RTE states that a beam of light loses energy through divergence and extinction (including both absorption and scattering away from the beam) and gains energy from light sources in the medium and scattering directed towards the beam. Coherence, polarization and non-linearity are neglected.
- Optical properties such as refractive index, absorption coefficient, scattering coefficient, and scattering anisotropy are taken as time-invariant but may vary spatially. Scattering is assumed to be elastic.
- aperture refers to an opening in a device through which light passes.
- the opening can be a physical opening, such as a hole in the device, or it can be merely an area that is sufficiently transparent to allow light to pass through.
- the aperture permits the direction of light onto a target or sample to be probed.
- tissue modulation refers to the modulation of blood flow within a target tissue. The modulation achieves blood replete and blood depleted states within the target tissue.
- blood replete refers to a state in which blood flow through a tissue is unobstructed by, for example, vasoconstriction induced by cooling or the application of pressure.
- the blood replete state can be enhanced by conditions that increase vasodilation, such as warming.
- blood depleted refers to a state in which blood flow through a tissue is substantially restricted and blood volume is minimized.
- a blood depleted state can be achieved by, for example, cooling and/or applying pressure to the tissue.
- tissue means any portion of an organ or system of the body, including, but not limited to, skin, capillary beds, blood, muscle, breast and brain.
- portion of tissue refers to an area of tissue that light penetrates, and from which a signal is collected.
- target tissue refers to an area of tissue that is to be probed for signal collection.
- Raman spectra associated with refers to those emitted Raman spectra that one skilled in the art would attribute to that component.
- Example 1 provides sufficient details to obtain the necessary raw measurements (published as Chaiken et al., 2009, J. Biomed. Opt. 14(5):050505). Those skilled in the art will appreciate variations on the process that would allow incorporation of different parameters as appropriate to adaptation of the process and apparatus to differing tissues and materials.
- volar-side fingertip capillary beds and how one can identify the contributions of various tissue sources to observed fluorescence.
- any volume of viable tissue naturally experiences spatial and temporal fluctuations of blood plasma and red blood cell (RBC) content and so it is useful to think of tissue as a three phase system, i.e. plasma and RBC volume fractions that are mobile and a static tissue volume fraction that is not.
- Probing tissue with near infrared (NIR) light simultaneously produces remitted fluorescence and Raman scattering (IE) and Rayleigh/Mie light scattering (EE) that noninvasively reveal chemical and physical information respectively about the materials and objects within.
- NIR near infrared
- IE remitted fluorescence and Raman scattering
- EE Rayleigh/Mie light scattering
- the IE and EE obtained by NIR probing yields useful information because the relevant set of optical coefficients describing propagation and attenuation of NIR is such that two of the fractions may be discriminated from each other on the basis of physical and chemical optical properties. Assuming there is no void volume in viable tissue, or at most that there is a constant void volume, permits the calculation of two relative volume fractions, for plasma and red blood cells, from simultaneous measurements of two observables, namely the EE and IE.
- the numerical analysis provided in Example 1 below shows the underlying phenomenology, whereas the following provides detailed guidance for calculating volume fractions of phases from that kind of raw data. This simple analysis allows a rational calculation of hematocrit and related fluid and tissue fractions from simultaneous measurements of IE and EE.
- FIG. 1 depicts a typical set of 20 msec CCD frames that have been integrated to show how the total wavelength shifted remitted light, that is, the IE varies in time relative to the elastically scattered light, the EE.
- the short time behavior, i.e. time ⁇ 100 msec, of the IE is dominated by photobleaching of the static tissues.
- sinus-cardiac interactions can be seen and generally there is complementary behavior of elastically scattered light (EE) versus in-elastically produced light, (IE) during cardiac pulses.
- EE elastically scattered light
- IE in-elastically produced light
- the present model for the structure of skin is consistent with empirical observations of the importance of blood mobility. It includes a relatively thin (100 ⁇ m), static, bloodless outer layer (a), covering a somewhat thicker (200 ⁇ m) relatively blood rich layer (b), that is bounded from below by a less blood rich layer (c) whose depth is essentially infinite.
- the single scattering limit and homogeneous distributions of the materials in each layer are employed.
- the physical presence or absence of capillaries is not as important as the mobility they extend to the blood; it is essential that, the motion of RBCs and plasma be accounted for separately.
- the fraction of the skin that is not blood, i.e. not RBCs and plasma, is considered “static” in that it deforms under external pressure and does not move.
- This idea has essentially nothing to do with specific cell types in skin, e.g. melanocytes, keratinocytes, etc.
- the optical transport coefficients (the set of ⁇ s and ⁇ a ) of dermis, epidermis, and even stratum corneum are not very different from each other.
- the different cell types may have significantly different fluorescence and Raman contributions but with respect to attenuation of the NIR light by elastic scattering and absorption, the particular type of static tissue is a less important distinction.
- the contribution to the integrated IE of fluorescence is substantially greater than the contribution of Raman, so unless stated otherwise, only the fluorescence component is considered when referring to the IE in what follows.
- IE is produced subsequent to an absorption event but also reflects the fluorescence quantum yield so, although the absorption coefficients of static tissue and RBCs are nearly equal and substantially greater than that for plasma, the greater the RBC content the greater the observed fluorescence.
- the hematocrit is the ratio of the RBC volume fraction to the sum of the RBC and plasma volume fractions that is, the fraction of the mobile tissues that is RBCs.
- the two volume fractions can be calculated from the two observables, IE and EE. In order to do this, values for eight scattering coefficients, four for elastic scattering and four for inelastic, must be estimated. How this is done is shown in the next section, in which the algorithm for calculating hematocrit from IE and EE is also presented. In the final section, some recent in vivo human clinical results are presented that illustrate the use of this algorithm.
- the model permits calculation of the intensity of scattered radiation from all three phases that is detected outside the skin, given volume fractions, absorption coefficients, and scattering coefficients for the three phases. It accounts for the variation in detected intensity with geometric parameters (placement of source and detector, etc.) and changes in volume fractions.
- a base calculation must be performed using the model in order to obtain some relations between the coefficients that enter the algorithm.
- the parameters that enter the calculation differ somewhat between individuals, excessive emphasis is not placed on their exact values; the numerical relations derived are only slightly affected by the variation.
- the dome formed when the fingertip is brought into registration with the 0.21 mm diameter optical aperture is assumed to be a spherical cap with radius 0.1 cm and height 0.005 cm.
- the origin of coordinates is in the center, 0.005 cm below the top of the dome.
- the volume fractions in Table 1 are based on estimates of the average capillary density, dimensions and a hematocrit of 0.10 for the blood in the most vascularized second layer.
- the third layer was given 10% of the total blood fraction of the second layer, i.e. from the top of the capillary loops down to the superficial dermal plexus, consistent with medium to deep dermis.
- the calculations show that, for all three phases, the contribution of layer c is much less than that of layers a and b, so that the assumptions made for layer c are not critical. Even if the total blood fraction is assumed to be as high as 0.05, the scattering length is very long compared with the dimensions of the layers and the single scattering limit is appropriate.
- volume fractions used were consistent Jacques' estimates for well perfused skin, as would be appropriate to fingertips.
- the estimates in Table 1 are more appropriate of forearm skin.
- the sum of the absorption and inelastic scattering coefficients, weighted by phase volume fractions, are added to give the attenuation coefficient for each layer.
- the calculated elastic scattering intensity from each phase is proportional to the corresponding elastic scattering coefficient, and the inelastic scattering intensity is proportional to the inelastic scattering coefficient times a quantum yield.
- the volume fractions (see Table 1) add up to unity, implying that there are no voids.
- the linear dependence is both direct (the amount of scattering from any phase at any point is proportional to the volume fraction of that phase at that point) and indirect (the scattering is proportional to the incident light intensity, which is determined by the attenuation, and the light reaching the detector is attenuated as well).
- the observed values of EE and IE depend on how they are measured and geometrical parameters of the system.
- the yield of measured scattered photons depends on the probed volume, the frequency range considered, and the incident laser flux.
- relations between the first three and relations between the second three can be obtained from the model calculations.
- volume fractions can be measured independently and associated with particular values of EE 0 and IE 0 , thereby providing independent absolute calibration for this measurement approach.
- the stated goal was a continuous real-time record of hematocrit (or some other rational function of the relevant blood fractions), in order to log temporal changes and reactions to external probing/examination. Differences in the skin optical properties across individuals are expected to affect the absolute values of the measured volume fractions but this does not diminish the value in monitoring their relative variation in time.
- ⁇ r 1.034740 ⁇ ( 1.003815 ⁇ EE EE 0 - 1 ) + 0.065018 ⁇ ( 1.000814 ⁇ IE IE 0 - 1 ) [ 8 ]
- ⁇ p 9.404260 ⁇ ( 1.003815 ⁇ EE EE 0 - 1 ) + 0.1558538 ⁇ ( 1.000814 ⁇ IE IE 0 - 1 ) [ 9 ]
- the measured set of EE and corresponding IE in FIG. 1 were combined using [8] and [9] to calculate the RBC and plasma volume fractions.
- IE 0 and EE 0 were calculated as a function of time by performing a 51 pt adjacent averaging smoothing on the IE and EE respectively. For each data point in the IE and EE, a corresponding set of IE 0 and EE 0 could be assigned from the corresponding smoothed data.
- the volume fractions sometimes take negative values, and for these times the volume fraction of skin is greater than 1.
- ⁇ r a + ( b ⁇ EE EE 0 ) + ( c ⁇ IE IE 0 ) [ 10 ]
- ⁇ p d + ( e ⁇ EE EE 0 ) + ( f ⁇ IE IE 0 ) [ 11 ]
- FIG. 5 shows the behavior of IE and EE when a skin sample in vivo is subjected to a tissue modulation cycle.
- FIG. 5 was obtained by having the fingertip engaged with a minimum of pressure, i.e. as “unpressed” as possible, and then at a later time a pressed condition was applied in order to move blood.
- the IE and EE shows what the RTE model also mimics—an increase of EE from ⁇ 65000 counts to ⁇ 67000 and a decrease of IE from ⁇ 32000 counts to ⁇ 29000 counts.
- the modulation produced a decrease in ⁇ rbc fraction by roughly 95% and a decrease in plasma fraction by roughly 90%. All of these observations constitute four constraints on the six parameters.
- nonlinear least squares (Excel Solver, or Mathcad genfit or old Lotus software are all quite adequate for this purpose) are used to choose the remaining two free parameters to make the calculated hematocrit as constant as possible, i.e. minimize the standard deviation of the Hct over the calibration period, i.e. calculate the Hct for each pair of EE and IE obtaining ⁇ r and ⁇ p . and from that calculate a set of HCT values from which a mean and standard deviation can be calculated.
- This Example describes simultaneous observation of elastic scattering, fluorescence and inelastic scattering from in vivo near infrared probing of human skin. Careful control of the mechanical force needed to obtain reliable registration of in vivo tissue with an appropriate optical system allows reproducible observation of blood flow in capillary beds of human volar side fingertips. Under continuous near infrared excitation, the time dependence of the elastically scattered light is highly correlated with that of the combined fluorescence and Raman scattered light. This is interpreted in terms of turbidity; i.e. the impeding effect of red blood cells on optical propagation to and from the scattering centers and the changes in the volume percentages of the tissues in the irradiated volume with normal homeostatic processes. By fitting to a model, these measurements may be used to determine volume fractions of plasma and RBCs.
- the optical properties of the tissues that the incident light encounters are summarized in Table 3.
- Table 3 The optical properties of the tissues that the incident light encounters are summarized in Table 3.
- Skin i.e. “static tissue” that does not move when pressed but instead deforms, has a ten-fold larger scattering coefficient than plasma.
- the elastic scattering coefficient of RBCs exceeds that of skin by at least a factor of 20 because of the match between the size of the RBCs themselves and the wavelength of incident light.
- the inelastic light originates from two distinct processes, fluorescence and Raman scattering.
- the fluorescence is stronger and ubiquitous and there are overlapping components from all tissues in the irradiated volume, i.e. plasma, RBCs and static tissue.
- the fluorescence yield per unit volume is different for plasma, RBCs and skin and all yields slowly become weaker and more equal as the excitation wavelength increases from 785 to 830 nm.
- the net observed fluorescence yields from the various tissues is somewhat different from the respective behavior of the ⁇ a in Table 3.
- FIG. 9 shows a raw typical single 20 msec frame of Andor CCD output using 200 mW and 830 nm excitation.
- the lower portion of FIG. 9 shows the same frame but on an expanded scale to show the sections of emission integrated to obtain combined fluorescence and Raman emission (500-1750 cm ⁇ 1 ; hereafter referred to collectively as “inelastic emission” or IE) and elastic emission ( ⁇ 30-+10 cm ⁇ 1 ; hereafter referred to as “elastic emission” or EE).
- the IE spectral region was chosen to exclude as much as possible of the Rayleigh line and any off-axis reflected light from the outermost stratum corneum.
- the EE region contains only the elastically scattered light and care must be taken not to exceed the dynamic range or otherwise damage individual pixels of the CCD for this measurement.
- a fingertip is brought into contact with a spring steel surface having a 2 mm diameter hole to define an aperture through which a 100 ⁇ m diameter laser beam contacts the fingertip, making an elliptical spot.
- the pressure at this point is 20 ⁇ 5 g/cm 2 and is almost imperceptible to some test subjects.
- Careful direct observation of the skin surface through the optical system during the entire process shows that the laser spot moves less than 10 ⁇ m throughout.
- the optical system allows the applied force and contact area to be continuously monitored, so that the resulting pressure between the fingertip and the spring steel surface is actively maintained.
- the tissue squashes and flattens, and the contact area increases throughout the experiment thus requiring a proportional increase in force to continuously meet the pressure set point.
- FIG. 10 shows typical data corresponding to the sequence described above.
- the IE and EE integrals are each plotted as a function of time.
- the data associated with the vertical axis of each plot was transformed to have a mean of 0 and standard deviation of 1 so as to facilitate their comparison.
- the data for t ⁇ 0.5 sec are shown.
- the IE drops rapidly while the EE is nearly constant.
- FIG. 1B shows some of the same data as FIG. 10 but using an expanded temporal scale to show the complementary and very nearly proportional behavior of EE versus IE light.
- the heart-driven pulses in both time records are obvious and can be easily confirmed as such using e.g. a common commercial blood pressure/pulse rate cuff and by doing successive experiments that change the test subject's pulse rate, i.e. varying levels of physical exertion or execution of the Valsalva maneuver.
- a common commercial blood pressure/pulse rate cuff and by doing successive experiments that change the test subject's pulse rate, i.e. varying levels of physical exertion or execution of the Valsalva maneuver.
- There are regular, longer timescale fluctuations observable in FIG. 10 that are also very reproducible and are at least partially due to known correlations between the heart pulse rhythms and breathing rhythms.
- plasma and erythrocytes are mostly confined to narrow capillaries ( ⁇ 25 ⁇ m) and the discharge and tube hematocrit are very nearly equal (i.e. within ⁇ 10%) due to gridlock.
- the effect of a relatively large change in IE due to plasma motion is compensated for by a very small modulation of RBCs so the RBC volume fraction is nearly constant.
- the IE temporal behavior corresponds to the increasing and decreasing local blood volume as blood pressure pulses propagate through the capillaries in the irradiated volume.
- the capillaries become slightly distended as an increased volume of plasma and RBCs occupies the capillary lumen during the increasing pressure pulse. Since the fluorescence is more efficiently generated than the Raman signal, fluorescence dominates the IE integral in the experiment.
- the observed variation in the elastically produced light is explained by the relative magnitudes of the scattering coefficients in Table 3.
- the RBCs have by far the largest scattering coefficient, determined by the physical optics of erythrocytes, the net change of elastically scattered light collected is most strongly associated with RBC movement. Although most of the observed Rayleigh/Mie light originates from static tissue because that tissue has the highest volume fraction, the efficiency of propagation of the excitation light to the static tissue and the efficiency of propagation of the elastically scattered light from the static tissue to the collection zone is decreases as RBC volume percent increases.
- the constructed model for the propagation and scattering of radiation through skin is based on radiative transfer theory that includes the attenuation of incoming radiation by scattering and absorption, the scattering of the radiation from all tissues, the propagation of scattered radiation from scattering centers to the detector and RBC and plasma volume fractions. Calculations based on the model successfully predict the optimum values for geometrical and other parameters of the apparatus. Using the parameters given in Table 3 and assumed values for volume fractions, it accounts for the effects described above, and gives their interpretation.
- the data in FIG. 10 are interpreted as showing that, when the IE is maximal, the combined volume of RBCs and plasma is maximal.
- the attenuation by the RBCs increases because the pulse injects RBCs into the irradiated volume.
- Simultaneous observation of the IE and EE gives two independent measurements, the IE, associated with the combined plasma and RBC volume fractions, and the EE, associated exclusively with the RBC volume fraction.
- the volar side fingertip capillary beds are probed with near infrared laser light and Raman, Rayleigh and Mie scattered light and fluorescence are collected. The results are interpreted using radiation transfer theory in the single-scattering approximation.
- the surface topography of the skin is modeled using the Fresnel Equations.
- the skin is treated as a three-layer material, with a mean-field treatment of tissue composition and related optical properties.
- the model with a reasonable choice of tissue parameters, gives a remarkably accurate account of the features of actual measurements. It predicts the optimal values for the incident angle of the laser beam and the distance between beam and detector.
- NIR near infrared radiation
- the elastically scattered light and the undifferentiated inelastically scattered light, containing both Raman scattered light and fluorescence, are simultaneously measured.
- vibrational spectroscopy specifically Raman scattering with NIR excitation
- the elastically scattered light a probe based on physical optics, provides information relating to the presence and disposition of red blood cells (RBCs) in the probed volume.
- RBCs red blood cells
- This Example presents and discusses the present model for analysis and interpretation of the measurements.
- the model considers the scattering and absorption, inside the skin, of a beam of NIR, and the propagation of the scattered radiation to a detector outside. (It is assumed that the scattering is isotropic, i.e. no preferred scattering angle.) It is used to discuss the effects of skin surface topography, i.e. doming and ridges, as well as the layer structure of skin.
- Ridged skin such as is found on volar side fingertips provides an important thermoregulation function and so is highly vascularized, presenting a blood-rich tissue to probe.
- the surface ridges can be commensurate with the diameter of the laser beam, making results depend on the placement of the laser beam on the skin surface.
- the sample being measured e.g. the tissue, must be brought into reproducible registration with an optical system.
- an external servo-driven actuator presses the fingertip against a circular aperture in a thin spring steel sheet and a NIR laser beam penetrates the skin through the exposed surface (Chaiken, et al., 2010, Rev. Sci. Instrum. 81, 034301).
- the various forms of emitted light are measured simultaneously with a CCD detector.
- the blood transmits a local pressure field into the probed volume, the diastolic and systolic pressure, in addition to the local hydrostatic and oncotic pressures.
- Pressure on the fingertip even very light constant pressure, has several effects. To the degree that the skin can deform, the pressure causes “doming” or extrusion of tissues into an aperture.
- constant pressure results in movement of fluid, e.g. blood, out of the irradiated region.
- fluid e.g. blood
- the contact area between the tissue and the surface containing the aperture changes, requiring an external servo system to obtain reproducible results.
- the amounts of inelastically scattered light and fluorescence collected are proportional to the intensity of incident light.
- the Fresnel's Equations are appropriate for calculating the effect of spatial inhomogeneity on light propagation when the path contains features (such as fingerprint ridges) which are large compared with near infrared (NIR) wavelengths.
- NIR near infrared
- the scattering coefficients account for interactions with interfaces and objects having index of refraction boundaries that are equal to or smaller than the NIR wavelength. Given the well defined anatomy of highly organized skin tissues, in vivo probing encounters a multitude of randomly arranged refractive index boundaries that are properly represented by the tabulated scattering coefficients.
- One goal is to construct a model that provides a conceptual framework that accounts for all the experimental observations and if desired could allow a best fit to quantitative measurements by adjusting a small number of parameters. Although it is possible to conceive of detailed models of skin structure with as many as five layers and many parameters, the possibilities for obtaining enough observables to properly test such a model are limited. Zhang suggests that a three-layer model is reasonable in the light of available empirical data, and such a model is used here (Tuchin, 2007, Tissue Optics, SPIE Press, Bellingham Wash., USA).
- the three layers are the stratum corneum and the superficial epidermis, the “capillary bed” that is mostly epidermis but extends inward to the superficial dermal plexus, and the dermis, respectively.
- stratum corneum and the superficial epidermis
- the “capillary bed” that is mostly epidermis but extends inward to the superficial dermal plexus
- dermis respectively.
- a planar geometry in the model layers a and b are defined by parallel planes
- the effect of extrusion into the aperture of the uppermost layer i.e. “doming” of the top surface of layer a
- the effect on scattered intensities of known changes like net blood flow into/out of the probed volume is considered.
- fingerprint ridges which are assumed to differ from the effect of subsurface scattering.
- the optical properties of the constituents of vascularized skin, i.e. plasma, RBCs, dermis and epidermis have been measured many times, giving mean-field values for the region probed.
- Jacques has estimated that in the most vascularized “layer”, the superficial dermal plexus 200-300 ⁇ m below the skin surface, the blood (plasma and RBCs) volume percent is 3-5% (1996, OSA TOPS on Advances in Optical Imaging and Photon Migration, Vol. 2, pp. 364-369, eds. R. R. Alfano, J G Fujimoto, Optical Society of America).
- the most important approximation in the model is the neglect of multiple scattering. Although appreciable fluorescence emanates from all the tissues in the probed volume, the RBCs are the strongest source, followed by the plasma and then the static tissues. An estimate of the volume fraction of blood in the probed volume is 5%. In clinical practice the measured hematocrit (volume fraction of blood which is RBC) depends on the size of the vessel from which the blood is sampled. The hematocrit of blood from a large vessel like the brachial vein is about 45%, but the hematocrit of capillary blood is about 10% or less on average.
- the volar side of a fingertip is placed in contact with a rigid flat stiff (0.025′′ thick spring steel) surface having a ⁇ 2 mm hole, chamfered) (10°) on the side facing the incident light.
- the incident light is free-space coupled to the skin with a 15 cm focal length plano convex lens.
- the size of this hole and the chamfering are chosen to minimize extrusion of tissue and to minimize the scattered light produced by interaction of the laser with the edges of the hole.
- the hole and surrounding surface cause a pressure-dependent stress field within the tissues in direct and indirect contact with the edges of the hole, which leads to motion of subsurface tissues.
- the spectrograph (Process Instruments, Salt Lake, Utah, USA) is fiber-coupled to a collection train consisting of a custom triplet collection lens, followed by a (Semrock Razor Edge) filter to remove the laser line, and then a refocusing lens.
- the 59-fiber bundle presents an AR coated circular target to the refocusing lens and a line configuration at the spectrograph entrance slit.
- the effective slit width is 70 ⁇ m and the net collection and spectrograph system is approximately f/2.
- the wavelength-dispersed light is imaged onto either an Andor DU420-BR-DD CCD camera operating at ⁇ 65° C. or a Critical Link MityCCD-E3011-BI CCD camera, cooled to ⁇ 45° C.
- a 5% reflectance pellicle can be introduced at 45° between the custom triplet and the refocusing lens. Illumination can be provided by a white light source from the collection side.
- the aperture (finger) can be imaged in real time through the triplet directly and reflected onto a separate NIR enhanced CCD camera. Images were captured using a SnappyTM frame grabber. White light illumination easily saturates the viewing CCD camera.
- the dynamic range of the CCD is challenged in attempting to use the Raleigh/Mie scattered light for spectral probing and imaging. Therefore, judicious use of neutral density filters is required to deal with illumination levels and saturation blooming to obtain good images.
- tissue modulation The pressure-induced motion is referred to as “tissue modulation”.
- tissue modulation In order to reproducibly execute these and even static pressure experiments, one must utilize a system that allows accurate and precise placement and pressure maintenance, as described in U.S. Pat. Nos. 6,223,063 and 6,289,230. It is also possible to employ wavelength selective filters to image the skin and thereby deduce perfusion patterns but for the current purposes, scanning the laser across the aperture while simultaneously collecting both the IE and the EE is found to be more useful. For this, the entire assembly containing the aperture is mounted on a stage that can be driven electromechanically relative to the stationary laser and collection system using a Newport NSA12 micropositioner.
- the regions used to calculate the integrated inelastic signal (IE) and the integrated elastically emitted radiation (EE) are indicated.
- the EE is dominated by elastically scattered light from all the tissues in the irradiated volume, but also contains light reflected from the skin surface.
- the inelastic signal includes fluorescence and Raman-scattered light.
- the IE is necessarily much smaller than the EE.
- the optical system is initially aligned so that the light is incident at the middle of the aperture if the sample is flat and in the plane of the aperture as can be seen in FIG. 12A for a thick flat piece of light grey DelrinTM.
- a finger is registered into the aperture in an unpressed state as in FIG. 12B , the ellipse of contact is slightly shifted to the side of the tissue towards the incoming laser light. If additional pressure is applied the point of contact moves further towards the side of the incoming laser as in FIG. 12C . This motion, as discussed in detail below, is down the side of the extruded dome of tissue.
- FIG. 12D shows the difference between images B and C, and demonstrates that the total displacement, even for a very hard applied pressure is only 10-30 ⁇ m.
- FIG. 13 shows data obtained by the former approach. Here a part of the fingertip was scanned where the ridges run perpendicular to the direction of motion, the fingertip being moved through a known distance in a known amount of time with relatively constant applied pressure.
- the IE and EE integrals shown in FIG. 9 are plotted versus distance translated. Both fluctuate by roughly 20% with a spacing of about 250 ⁇ m, characteristic of fingerprint ridges.
- the spatial fluctuations in the EE integral and the IE integral are complementary: one increases when the other decreases.
- FIG. 14 shows data obtained using the second approach for four test subjects: petite Asian female (28 yrs old), large (6′4′′ 255 lbs) Caucasian male (19 yrs old), average size Caucasian male (54 yrs old) and average size Middle Eastern male (78 yrs old).
- the pressure used to maintain optical registration between the fingertip and the aperture was the average of the diastolic and systolic pressures measured with a commercial automatic blood pressure cuff (Omron).
- the data consist of 50 consecutive 20 msec CCD frames acquired at fixed positions spaced at 20 ⁇ m intervals. A large increase in EE at the extreme right due to reflection as the laser beam strikes the outside of the aperture has been cropped.
- a beam of NIR laser light is incident on the top surface of skin at an angle ⁇ ′ relative to the vertical as shown in FIG. 15 , which assumes planar geometry, i.e. smooth skin with no extrusion into the aperture.
- the apparatus is aligned so that the angle of incidence of the light, i.e. ⁇ ′, is near Brewster's Angle for an index of refraction for layer a equal to that of water.
- the actual index of refraction of “tissue” is somewhat higher, but observations reflect modulation of the optical signals due to the motions of subsurface fluids and deformation of static tissues, which do not reflect exactly the anatomical divisions for which individual indices have been measured, i.e. stratum corneum, epidermis, dermis. Thus water is used for reference.
- the detector is represented as a circular area parallel to the skin surface, with its center, C in FIG. 15 , a distance d from the center of the incoming laser beam. The diameter is consistent with the net f-number of the first collection lens. Radiation passing through this “collection circle” from below is considered detected. The amount of radiation entering the collection circle is calculated, given the intensity and direction of incoming radiation and the parameters characterizing the skin. The main assumption made is single scattering, i.e. each photon entering the detector is produced by a single scattering event.
- the planar interface is replaced by a spherical cap.
- the incoming or outgoing transmission coefficient depends on the points at which incoming or outgoing radiation enters and leaves the skin. In either planar or dome geometry, radiation passing through this “collection circle” from below is considered detected.
- the subsurface skin is modeled as a three-layer planar system.
- the top layer (layer a, stratum corneum plus the upper nonviable part of epidermis starting at the distal ends of the capillaries) has thickness t a
- the middle layer (layer b, epidermis including capillary bed ending with projection of vessel to superficial dermal plexus) has thickness t b
- the third layer (layer c, dermis) is assumed to be infinitely thick.
- the last assumption is not a source of error because only a small fraction of the collected light comes from layer c, due to the attenuation of both the incident and the scattered light.
- t a 0.02 cm
- t b 0.04 cm.
- r red blood cells
- p plasma
- t static tissue.
- the volume fractions of the three phases in the three layers are denoted by ⁇ ra , ⁇ pa , ⁇ ta , ⁇ rb , etc.
- ⁇ ra + ⁇ pa + ⁇ ta. 1 and so on.
- the volume fractions used typically in the present calculations are given in Table 1.
- Each phase has characteristic absorption and scattering coefficients, denoted by ⁇ and ⁇ respectively.
- ⁇ and ⁇ characteristic absorption and scattering coefficients, denoted by ⁇ and ⁇ respectively.
- Table 2 first two columns
- the phases are distributed randomly in each layer. This allows one to calculate an average absorption coefficient and an average scattering coefficient for each layer, and a total attenuation coefficient that is the sum of the absorption and scattering coefficients.
- ⁇ b ⁇ rb ⁇ r + ⁇ pb ⁇ a + ⁇ tb ⁇ t
- ⁇ c ⁇ rc ⁇ r + ⁇ pc ⁇ p + ⁇ tc ⁇ t .
- the incident radiation is assumed to enter the skin from the space above as a beam centered at the origin, O, and making an angle ⁇ ′ with the normal to the skin layers ( FIG. 15 ).
- the transmission coefficient for radiation entering the top layer is calculated from the reflection coefficients for s- and p-polarized radiation,
- R s [ cos ⁇ ( ⁇ ′ ) - n r ⁇ cos ⁇ ( ⁇ ) cos ⁇ ( ⁇ ′ ) + n r ⁇ cos ⁇ ( ⁇ ) ] 2 ⁇ ⁇
- R p [ cos ⁇ ( ⁇ ) - n r ⁇ cos ⁇ ( ⁇ ′ ) cos ⁇ ( ⁇ ) + n r ⁇ cos ⁇ ( ⁇ ′ ) ] 2 [ 1 ]
- the Fresnel equations are used as if the light were unpolarized to attempt to simulate three dimensional variation in the skin surface since to the extent that there is three dimensional tortuosity, both polarizations would contribute to the reflected light and the reflection loss for penetration into the skin. This assumption is made to justify the choice to calculate the trajectory at the interface in two dimensions only. Although the reflected light is only one to two percent of the incident light, its intensity is much greater than the elastically scattered light from plasma and RBCs (see below); it is much smaller than that from static tissue.
- the vertical axis is taken as the z-axis, the positive direction being down, i.e. into the skin.
- the incident beam is in the x-z plane.
- the angle ⁇ is defined as ( ⁇ /2) ⁇ .
- I I o ⁇ exp ⁇ [ - ⁇ 0 l ⁇ ( ⁇ + ⁇ ) ⁇ ⁇ d t ] [ 2 ]
- the scattering probability must be multiplied by the probability that the scattered radiation enters the collection circle, P c .
- P c is equal to the ratio of the solid angle subtended by the collection circle to 4 ⁇ .
- the collection circle projects to an ellipse with semi-axes r (in the y-direction) and r/(cos ⁇ ) (in the direction perpendicular to y), where ⁇ is the angle between the line PC and the z-direction (see FIG. 15B ).
- the solid angle subtended by the ellipse is the solid angle sought.
- I net I o ⁇ T ⁇ ⁇ 0 ⁇ ⁇ ⁇ d l ⁇ ⁇ exp ⁇ [ - ⁇ 0 l ⁇ ⁇ d t ⁇ ( ⁇ + ⁇ ) ] ⁇ ⁇ x ⁇ ⁇ x ⁇ ( z ) ⁇ P c ⁇ exp ⁇ [ - ⁇ 0 m ⁇ ⁇ d t ⁇ ( ⁇ + ⁇ ) ] [ 5 ]
- the integral over I sums contributions from all points along the line OP (extended to a depth so that further contributions are negligible).
- the quantity I net represents the scattering from an infinitely narrow beam.
- calculate I net is calculated for four entry points along the x-direction and average. That is, if d denotes the entry point for the center of the beam, and db the beam diameter (here 0.01 cm), one repeats the calculation for d ⁇ 0.40451 db, ⁇ tilde over (d) ⁇ 0.15451 db, d+0.15451 db, and d+0.40451 db and multiply the four results by 0.13820, 0.31680, 0.31680, and 0.13820 respectively. These are the 4-point Gaussian quadrature points and weights for integrating over a circular area. The sum of the four terms is the scattered intensity averaged over a circle of diameter db.
- the results are shown in FIG. 17 .
- the curves correspond to static tissue, red blood cells, and plasma.
- polynomial fits are drawn (cubic, quadratic, and cubic respectively).
- ⁇ ′ was fixed at 53.2° or 0.929 radians, which is the value used in the apparatus. (It was determined to be the best choice empirically, and the choice was confirmed by calculations of pressure-modulated intensities using the program, as explained below.)
- the optimal value of d for tissue scattering is very small, since this scattering is dominated by the contribution of the top layer. From parabolic fits, the optimum value of d for scattering from red blood cells is 0.02030 cm, and that for plasma is 0.02030 cm. Getting more signal from greater depth requires larger values of d for a given angle, since this maximizes the path length in layer b.
- FIG. 18 shows the subtracted intensities plotted against the angle ⁇ ′.
- d was fixed at 0.02 cm and f was 0.1.
- the curve in the figure is a cubic fit, for clarity.
- the optimum value of ⁇ ′ is calculated to be 0.9783 radians or 56.5°. This is very close to the value established experimentally earlier, 53°.
- a series of calculations to establish the optimum value of d for modulated intensities was also conducted.
- pulse modulation Another way to cancel out much of the scattering from static tissue is pulse modulation, in which the EE and IE are monitored over time. Each pulse gives an increase and then a decrease in both ⁇ b and ⁇ p the volume fractions of RBCs and plasma. Since the fluorescence per unit volume is relatively large for the RBCs, the IE increases when ⁇ b increases regardless of what happens to ⁇ p . This leads to only a small change in the EE originating from the RBCs themselves. However, their large scattering coefficient means that RBCs impede propagation of all light in the volume, so that an increase in ⁇ b increases the attenuation of the incoming and outgoing beams. Since static tissues have the largest volume fraction, increased ⁇ b decreases the total EE, which explains why the IE and EE are found to be out of phase in pulse-modulated measurements. The present model can be used to calculate the effect.
- pressure modulation is done by pressing the fingertip against a metal plate in which a circular hole of diameter D has been made, with the incoming laser beam and the detector on the other side of the plate. While pressing the fingertip in this way does remove fluids from the irradiated volume, it also extrudes tissue into the hole, resulting in formation of a dome.
- the resulting change in the detected scattered radiation depends, obviously, on where the beam enters relative to the circumference of the hole. The importance of this “doming” is calculated using the single-scattering model.
- FIG. 20 shows the geometry of the situation in the x-z plane.
- the x-y plane (x-axis in the 2-dimensional diagram) is the top surface of the skin with no doming, and the z-axis is in the downward direction, into the skin.
- the circular segment in FIG. 20A represents the dome formed by the fingertip's pressure on the plate; since it is defined by the hole in the plate, it has diameter D.
- the dome is assumed to be spherical and the maximum height above the x-y plane, at the dome center, is called h 0 .
- the geometrical parameter to be varied is x 0 , which corresponds to moving the measurement apparatus (laser beam and detector in unison, separated by a distance d) across the hole in the plate.
- the incoming beam would cross the top surface of the skin (the x-y plane) at the origin, and make an angle ⁇ ′ with the external normal (negative z-axis), as shown in the diagram.
- the angle it makes with the internal normal would be ⁇ .
- the angle the incoming beam makes with the external normal to the dome differs from ⁇ ′ (in FIG. 20A , it is very close to 0), so its direction inside the skin differs from ⁇ ; the difference is greater, the farther one gets from the center of the dome.
- the intensity of scattering is proportional to the intensity of the beam, attenuated according to the path length from the entry point to the point of scattering.
- (x,y) is a point along the beam trajectory and (x d ,y d ) is the center of the detector.
- the normal to the sphere at the point where the scattered radiation crosses it is shown as a dashed line.
- the path the scattered radiation takes to the detector is also altered because of the dome geometry, since refraction occurs at the skin surface (angles ⁇ and ⁇ ′ relative to the normal to the surface).
- the point of intersection of the scattered beam with the surface must be calculated so that ⁇ and ⁇ ′ obey Snell's Law, and the transmission coefficient for the beam leaving the skin must be calculated.
- the angles the beam inside the skin makes with the z-axis are 0.819, 0.771, and 0.706 respectively; the corresponding transmission coefficients are 0.981, 0.976, and 0.963.
- x 0 approaching ⁇ D/2 or +D/2 one has to correct for the masking of the beam or the detector by the plate, since one or the other passes outside the aperture. Because of the nonzero widths of both the detector and the beam, the masking is gradual at each end. The contribution of reflected light from the aperture to either total EE or IE signal is discussed later.
- FIG. 21 shows how the calculated EE scattering intensities from static tissue (panel A), red blood cells (panel B), and plasma (panel C) change with x s .
- increasing x s corresponds to moving the aperture from right to left, or to moving the incoming beam and the detector from left to right, with the distance between the two fixed at 0.022 cm.
- the masking of the beam is responsible for the drop of intensities to zero for x s ⁇ tilde over ( ⁇ ) ⁇ 0.12 and the masking of the detector is responsible for the drop for x s ⁇ +0.08.
- the parameters associated with the production of EE are very different from those for the production of IE, the total IE production is dominated by the static tissue because of its dominant, >95%, volume fraction in any layer.
- the preceding Example has shown how the well-known “autofluorescence” of static tissue can be bleached by the excitation laser; this effect can be seen in the results in FIG. 14 .
- the IE decays with time at each of the scan locations unlike with the EE.
- the calculated variation in production of EE reveals the location of the exciting light, which is available to be absorbed by whatever species cause the autofluorescence in static tissues thereby also accounting for variation in the production of IE.
- the measured EE contains a significant direct contribution from the light reflected specularly from the skin surface.
- the results of the calculations for the reflection from 1 cm diameter skin are shown in FIG. 21 , panel A, as empty squares. (The intensities are zero for x s > ⁇ 0.03 because the reflected light can not enter the detector.)
- When added to the calculated EE they produce the points labeled with x's in FIG. 21A .
- Visually scaled and offset, the results with and without the reflectance contribution are also shown as thick black lines in the EE and IE results in FIG. 14 respectively.
- the reflected light from the aperture itself (with associated chamfer since the aperture is not infinitely thin) seen in the Delrin EE also contributes to the excess IE observed in vivo. Note that in general the net IE signal is only ⁇ 10% of the EE signal and this excess fluorescence is much smaller for the Delrin which has dome height 0 so it cannot be easily seen in FIG. 14 . This is considered an indirect effect of specularly reflected light.
- the angle of incidence does not change with the placement of the beam.
- a dome it varies systematically with the position of the beam entry point.
- the actual surface of the skin is neither flat nor a dome because of the fingerprint ridges, which have a spacing of about 600 ⁇ . Since the beam diameter is of the order 200 ⁇ m the beam could illuminate mostly one ridge top, or straddle a ridge top and bottom. If the beam is incident near a ridge boundary, the angle of incidence of some of the incoming photons will be much larger or smaller than 53°, and the scattering intensity can change significantly with a small change in the incident angle. Thus, moving the aperture across the fingertip produces not only a monotonic variation of intensity due to doming, but also oscillations commensurate with the spacing of the fingerprint ridges.
- the profile shown in panel A of FIG. 22 is used to discuss this effect.
- the ridges are assumed to have a spacing of 600 ⁇ m; alternate ridges are assumed to have heights of 120 ⁇ m and 60 ⁇ m (the alternation in height is an observed feature of actual fingerprint ridges).
- Each ridge is represented by the double-Gaussian function
- y h 4 [ 1 + erf ( x - x 0 + w 2 s ⁇ 2 ) ] [ 1 - erf ( x - x 0 - w 2 s ⁇ 2 ) ]
- h 120 ⁇ m or 60 ⁇ m
- w is the width (450 ⁇ m)
- s is the shape parameter, equal to 30 ⁇ m.
- the values of the parameters are chosen to give the ridges and the valleys between them a shape close to what is actually observed.
- the trajectory of the incoming ray is calculated at 53° to the vertical and where it intersects the profile and the angle ⁇ ′ it makes with the external normal to the profile at the point of intersection is determined. From ⁇ ′ one obtains ⁇ and calculates the transmission coefficient T, using [1].
- the IE and EE plots are complementary because the optimum angle of incidence is different for radiation scattered from static tissue, dominated by layer a, and for radiation scattered by blood, found only in layers b and c. If one layer produces greater IE per unit volume than another, passing through the angle that optimizes signal from that layer will produce an increase in the observed. IE.
- the layer thicknesses were chosen to reflect the fact that the blood is mostly localized in a region between two others that barely contribute to the modulated signal when blood moves.
- the present model allows us to understand the effects of pressure modulation and ridged skin on the scattered intensity.
- the path of the laser light transmitted into the probed tissue is distorted by the surface topography, changing the angle of incidence and thereby the depth probed for a given experimental geometry.
- Production of fluorescence is much more efficient than production of Raman-scattered light and so reflects the conditions from a greater depth.
- Rayleigh/Mie scattered light originates from as deep as 2 millimeters per calculations, so observed fluorescence may actually approach that depth.
- the skin is modeled as three-layer and the requisite three phases are present: red blood cells, plasma, and static tissue, with the first two absent from the top layer.
- Values from the literature are used for the scattering and absorption coefficients and the volume fractions of the three phases. It is assumed that the phases are distributed randomly in the second and third layers, allowing calculation of average scattering and absorption coefficients of these layers. These determine the attenuation of incoming and scattered radiation, as well as the scattering probability at each point.
- the intensity of detected radiation coming from each of the three phases (Equation 5).
- the expression involves an integration over all points along the beam from which scattering may occur. To take into account that the laser beam is not infinitely thin, the average is taken over an appropriate circular cross-section.
- the angle ⁇ ′ between the incoming beam and the external normal to the skin is independent of the point of entry of the beam.
- the angle ⁇ ′ depends on the point of entry.
- the angle between the incoming beam and the external normal to the dome is calculated as a function of the position of the entry point of the beam and, using Snell's Law, the angle between the refracted beam inside the skin and the internal normal, as well as the transmission coefficient at the skin surface.
- the transmission coefficient varies very little with the point of entry, but the variation in the reflection coefficient, itself about 0.02, is important because reflected radiation may contribute to the collected elastic scattering.
- the variation in detected scattered light intensity is most important.
- FIG. 21 shows how the calculated elastic scattering intensities from static tissue, RBCs, and plasma change with beam entry position x 0 when the skin is stationary with respect to the aperture.
- the same calculated results are superimposed on the observed variations of intensities in FIG. 14 and are very well reproduced, especially when the direct and indirect effects of all the specularly reflected light are included.
- the (actual) intensity from static tissue decreases (by about 30%) and then increases with x 0 , while the intensities from red blood cells and from plasma increase (by about 10%).
- the observed total EE intensity, dominated by the scattering from static tissue decreases in the scanned direction faster than calculated, consistent with the notion that for a given dome height, the dome edges approach the edges of the aperture faster than would a spherical cap.
- the IE is characterized by very different scattering parameters from the EE, which compensates to some extent for the very different volume percentages of the phases. Nevertheless, the IE yield in FIG. 14 is close to that predicted for the EE suggesting that the IE from the plasma and RBCs is small compared to that from the static tissues. This is consistent with the observed net modulation of the time dependent IE signal with the cardiac driven pulse, ⁇ 5-10%.
- the intensity oscillations are due to the changing incident angle of the beam as it passes across fingertip ridges. Since the spacing of the fingerprint ridges is about 600 ⁇ m, and the beam diameter is only 200 ⁇ m, the beam illuminates only a portion of a ridge, and the incident angle depends strongly on where on the ridge the beam impinges. The oscillations are in opposite directions because, as shown in FIG. 17 , the optimum incident angles for static tissue and for blood are very different.
- the model shows the difference between the IE data obtained by moving the finger relative to the stationary aperture and optical system, and the data obtained by scanning the aperture and the finger together across the optical system.
- the former FIG. 13
- the dome is probed at variable depth as the aperture is scanned across the optical system or, equivalently, the optical system scanned across the dome.
- the photographic study FIG. 12
- the entry point of the laser moves less than ⁇ 20 ⁇ m.
- the major axis of the elliptical spot is much wider than the motion of the spot induced by the increased dome height.
- the laser power for obtaining FIG. 12 was much reduced to obtain images with a minimum of CCD blooming.
- the model supports the idea that in a modulated experiment a nearly identical volume is probed for the pressed and unpressed states.
- the signal collected during the unpressed measurement originates from deeper tissues. Because these are richer in blood than the more superficial tissues, the tissue-modulated, i.e. unpressed minus pressed spectrum, is enriched in Raman features originating with blood as originally claimed.
- the tissue-modulated spectrum obtained by subtracting the pressed from the unpressed spectrum therefore is enriched in Raman features and fluorescence originating from blood, in agreement with earlier observations of correlation between the modulated Raman spectra and blood glucose levels measured independently.
- the separation of the lines indicated by U and P are greatly exaggerated in FIG. 14 and in reality they are >95% superimposed on each other.
- tissue modulation should produce spectral features originating with subsurface blood in the capillary network, making it possible to measure glucose and other blood analytes non-invasively using Raman spectroscopy.
- This approach has evolved so that, in addition to considering essential human factors of the measurement process, it strives to at least partially mitigate the effect of turbidity and inter-subject skin differences, by managing RBC content and movement across test subjects and for one test subject across time.
- the model presented herein for transmission and scattering of a laser beam through three layers of skin is able to interpret all of the experimental observations.
- the model allows determination of the optimal configuration of laser beam and detector for collecting scattering from static tissue and blood phases. It can take into account the effect of pressure-induced deviations from a flat skin surface. It explains the origin of the alternation between IE and EE observed in both temporally modulated and spatially modulated experiments.
- the ability of this model to predict all of these aspects of the measurement process suggests that a single-scattering, isotropic model is adequate to describe the information derived from probing of skin using NIR radiation.
- the single-scattering isotropic model should also suffice for modeling the probing of other skin locations with lower blood content, such as forearms.
- this model provides a firm theoretical basis for using the measured spectra of scattered light to determine, noninvasively and in vivo, blood properties like glucose concentration and hematocrit, as well as skin properties like turgor.
- NIR fluorescence i.e. “autofluorescence”
- autofluorescence is well known to originate in blood tissues and various other endogenous materials associated with the static tissues.
- Noninvasive in vivo tissue and blood analysis is a long-standing goal of the biomedical spectroscopy community.
- the work here is primarily focused on the use of near infrared (NIR) spontaneous Raman and fluorescence spectroscopy to monitor blood analytes including glucose.
- NIR near infrared
- the presence of ubiquitous NIR fluorescence is well-known although poorly understood despite the fact that it is a more or less serious impediment to most approaches to NIR noninvasive in vivo tissue and blood analysis.
- This Example describes recent work directed at clarifying the origin and nature of such fluorescence. The technological ramifications of this knowledge may be important with respect to noninvasive blood glucose monitoring using NIR Raman spectroscopy.
- fluorescence was used as a measure of the probed volume generally and, in a modulated approach, the blood volume that should be used to calculate the concentration of a substance based on the strength of a particular Raman feature (U.S. Pat. Nos. 6,223,063 and 6,289,230).
- autofluorescence has a broad emission spectrum that is believed to have no peak at least to 925 nm.
- every volume fraction of the irradiated volume i.e. static tissue, red blood cells and plasma produces emission.
- Interstitial volume and associated fluids are included with “static tissue” because these materials deform spatially but do not translate appreciably with application of external pressure.
- porphyrins are well known to produce copious fluorescence under NIR excitation.
- cytochrome species that are found exclusively in the static tissue are fluorescent but they exist in very small quantities relative to the other porphyrins and so are probably a minor contributor to the net porphyrin based emission.
- Bacteria are known to produce porphyrins on the skin that for a given test subject could be significant. In fact there are probably a number of minor contributors, porphyrins and non-porphyrin, and this makes a complete description of the net fluorescence more difficult.
- FIG. 23 A schematic diagram of the instrumentation, i.e. a LighTouchTM measurement device, is shown in FIG. 23 .
- Incident light 10 emitted by the laser 12 passes through a clean-up filter 14 and plano-convex focusing lens 16 through an aperture in a steel sheet 18 against which the fingertip 20 to be probed is positioned.
- Collected light 22 passes through a compound collection lens 24 , “razor edge” filter 26 , and a refocusing lens 28 , to a fiber optic bundle 30 that leads to the spectrograph 32 .
- a set of two electronic shutters that are inserted between the clean up filter 14 (Semrock) and the input coupling lens 16 allowing application of various pulse sequences to the fingertip 20 using the CW external cavity diode laser 12 (either Sacher or Process Instruments).
- the collected light 22 is imaged using a nominally f/2.1 spectrograph 32 onto a (Critical Link or Andor) CCD camera.
- a fused silica cuvette is employed for liquid samples and the light is detected by a Roper Scientific/PAR CCD camera after dispersion by a Kaiser f/1.4 Holospec spectrograph.
- the optical aperture is machined into a spring steel sheet 18 so that the movement of the aperture is less than 25 ⁇ m even for the largest applied pressures, i.e. force.
- the finger is reproducibly positioned relative to the optical aperture and at a well-defined pressure using a specially configured load cell (Omega LCKD) and a set of conductive gold spots.
- the 34 spots are placed in a pattern relative to the optical aperture such that when skin makes simultaneous contact with a set of dots and a thin gold annulus enclosing the optical aperture, the decrease in electrical resistance allows the software to estimate the total contact area between the skin and the spring steel surface. Knowing the contact area and the total applied force one can calculate the applied pressure.
- FIG. 9 A typical raw 20 ms CCD frame from a fingertip (200 mW, 830 nm excitation, no instrumentation function correction applied) is shown in FIG. 9 .
- the applied pressure is the average of the diastolic and systolic pressures, in this case ⁇ 60 g/cm 2 .
- the integrated fluorescence and Raman emission is referred to as inelastic emission, i.e. IE, and the Rayleigh line as elastic emission, EE.
- the amide I, CH 2 deformation, and amide III modes are clearly visible at ⁇ 1660, ⁇ 1450 and ⁇ 1270 cm ⁇ 1 respectively as is the underlying broadband fluorescence.
- a series of experiments were performed to test the dynamic behavior of the fluorescence because subcutaneous materials that may move spatially may have different characteristics than that originating from stationary sources.
- the IE and EE integrals for each frame are shown in FIG. 9 as BV and RBC respectively because the IE contains the dynamic fluorescence of the plasma and the RBCs in addition to a component from the static tissue whereas the EE signal has been shown to decrease as RBC volume percent increases due entirely to physical optical effect of the dominant scattering coefficient in the tissues, the ⁇ s of the RBCs.
- the finger is maintained motionless with the laser blocked and the pressure at the set-up level i.e. ⁇ 15 g/cm 2 for about 10 s before the laser is unblocked and the pressure is restored to 60 g/cm 2 .
- This pressure is again maintained while the B pair is collected.
- the initial IE of the B data nearly the same as the end of the A data and any initial drop in IE emission in the first few seconds is small compared to the initial drop observed for the A data.
- the EE emission for A and B data are very nearly the same and all the data show evidence of pulsing for their entire time courses.
- the same set-up procedure was executed placing the skin in a slightly different position with respect to the fingerprint ridges.
- the arm and hand were kept motionless and in contact with the actuator and the aperture as before the A run but not irradiated for a period of time equal to the A data collection period so that any fluid redistribution due to the changing hydrostatic pressure associated with assuming different body postures, i.e. sitting versus standing, would have time to occur but without laser irradiation.
- the dynamics of the C pair data is nearly identical to that of the A pair data although the average value of the EE of C data is less than that for either of the A or B data while the IE of C data is greater than that of the A data. Obvious heart pulsing is observable throughout all the data. The drop in IE is associated with the presence of the laser and not due to any change in hydrostatic pressure.
- FIG. 27 A typical scan obtained in this manner is shown in FIG. 27 .
- the laser is allowed to contact and thereby “photobleach” the motionless skin near the center of the aperture for 50 s at 200 mW and 100% duty cycle.
- another low duty cycle scan is conducted to reveal the effect of the photobleaching step.
- the fluorescence in the irradiated region is decreased by about 15-20% in the case of the non-diabetic test subject shown, and for all test subjects the bleaching effect has been observed to persist for as long as 45 min with the finger stationary and without any observed recovery of fluorescence.
- more test subjects need to be included to establish this as a general empirical fact, so far test subjects with diabetes photobleach roughly twice as deeply as the non-diabetic test subjects, regardless of age.
- the few substances that contribute appreciable fluorescence above the water background were hemoglobin, plasma, melanin, gelatin and early Maillard products of ribose, lysine and arginine mixture.
- the photobleaching of hemoglobin is shown in FIG. 28A as is the recovery when the bleached solution is allowed to recover in the dark for 1.5 hrs before retesting.
- the bleaching of melanin can be seen in FIG. 28B but the recovery is much less complete even when the solutions are allowed to recover for 2 hrs.
- Similar experiments on melanin which allow more than 12 hrs overnight recovery show comparable results with no noticeable fluorescence recovery.
- FIG. 29 was obtained from a mixture of Maillard reaction intermediate products by mixing ribose, lysine and arginine in a PBS buffered solution under constant 80° C. incubation. This reaction is much faster for pentoses than hexoses but the interconversion of these sugars in vivo is well-known and this reaction mixture is intended to mimic the glycation of collagen and other proteins, in the cytosol, interstitial fluids, plasma and extracellular matrix. Although Monnier monitored the reaction using UV-visible absorption and fluorescence, this is the first recognition that the early and probably late Maillard products are fluorescent in the NIR spectral range.
- the observed photobleaching effect in vivo and the recovery dynamics in vitro are favorable for the application of fluorescence as a volume normalizer.
- the observed photobleaching effect in vivo is nearly complete after about 20 s of NIR irradiation at ⁇ 150 mW and it is suspected to be even faster at higher power illumination.
- the tissues of a least 12 test subjects, once bleached, do not recover appreciably for many tens of minutes so once a monitoring site on the skin is selected, the artifact to a volume normalization using IE becomes unimportant after the initial bleaching.
- a NIR Raman measurement protocol should contain a prebleaching segment, perhaps using wide area illumination at higher power than was employed herein.
- other wavelengths may also be more efficient at bleaching and this will have to be determined with continued experimentation.
- the emission from blood may reach a steady state in practice when the laser induced emission is balanced against the laser induced bleaching process.
- Heart driven pulses are always observable and so a steady state is apparently reached very quickly, relative to heart beat frequency and blood flow rate in vivo.
- Melanin is at best a difficult material to assess because it has a unique environment in vivo that is difficult to mimic in vitro. Nevertheless, although UV-visible emission has been reported, this is believed to be the first report of NIR excited emission from melanin. The oxidation state of melanin has been shown to be important in its UV-visible emission and may also be important in vivo. There are various endogenous and exogenous sources of porphyrins beyond hemoglobin that are expected to contribute their own emission. In addition, these materials are known singlet oxygen sensitizers that can be expected to (1) contribute some emission from the singlet oxygen itself, and (2) interact with other substances, e.g. melanin to alter their emission properties. Some skin, e.g. palmer skin and volar side fingertip skin contains much less melanin than other tissues and these effects will be reduced for the monitoring sites.
- the cytosol of any cell that can support glycolysis also has the enzyme complement to support the pentose phosphate shunt that produces ribose from glucose.
- Ribose participates in the Maillard reaction roughly 30 times faster than does glucose and so intracellular glycation is likely to be extensive for diabetics compared to non diabetic people, regardless of age.
- the glycation of non-diabetics is likely dominated by extracellular chemistry whereas that of diabetics is intracellular in nature. Thus the apparent increase in fluorescence and bleaching of diabetics could result from this effect.
Landscapes
- Life Sciences & Earth Sciences (AREA)
- Health & Medical Sciences (AREA)
- Physics & Mathematics (AREA)
- Heart & Thoracic Surgery (AREA)
- Molecular Biology (AREA)
- Pathology (AREA)
- Engineering & Computer Science (AREA)
- Biomedical Technology (AREA)
- Optics & Photonics (AREA)
- Medical Informatics (AREA)
- Biophysics (AREA)
- Surgery (AREA)
- Animal Behavior & Ethology (AREA)
- General Health & Medical Sciences (AREA)
- Public Health (AREA)
- Veterinary Medicine (AREA)
- Spectroscopy & Molecular Physics (AREA)
- Measurement Of The Respiration, Hearing Ability, Form, And Blood Characteristics Of Living Organisms (AREA)
- Investigating, Analyzing Materials By Fluorescence Or Luminescence (AREA)
Abstract
Description
and wherein EE is total elastically (unshifted) emitted light, IE is total inelastically (shifted) emitted light,
b=(0.00008−0.02626)c/(−0.0208) and e=(0.00072−0.02626)f/(−0.0208)
0.00376=a+1.0303b+0.90407c.
b=−0.00792−3.657c.
e=−0.09504−3.657f.
| Elastic | Inelastic | ||
| (Rayleigh) | (fluorescence) | ||
| Absorption | scattering | scattering | |
| Phase | coefficient | coefficient | coefficient |
| r = rbc | αr = 4.5 cm−1 | μr = 300 cm−1 | 4.5 cm−1 |
| p = plasma | αp = 0.3 cm−1 | μp = 0.60 cm−1 | 0.30 cm−1 |
| t = static tissue | αt = 5 cm−1 | μt = 12 |
5 cm−1 |
| TABLE 1 |
| Assumed volume fractions of the three phases in the three layers |
| Phase | Layer a | Layer b | Layer c | |
| p = plasma | 0.00 | 0.0072 | 0.001200 | |
| r = red blood cells | 0.00 | 0.0008 | 0.000133 | |
| t = static tissue | 1.00 | 0.9920 | 0.998667 | |
| TABLE 2 |
| Absorption and scattering coefficients for the three phases |
| Elastic | Inelastic | ||
| (Rayleigh) | (fluorescence) | ||
| Absorption | scattering | scattering | |
| Phase | coefficient | coefficient | coefficient |
| r = rbc | αr = 4.5 cm−1 | μr = 300 cm−1 | 4.5 cm−1 |
| p = plasma | αp = 0.3 cm−1 | μp = 0.60 cm−1 | 0.30 cm−1 |
| t = static tissue | αt = 5 cm−1 | μt = 12 |
5 cm−1 |
1=φr+φp+φs [1]
0=dφ r +dφ p +dφ s [2]
in any phase. Good agreement between theory and experiment was obtained by summing the contributions from each phase and each layer. Obviously, one can measure only the total elastic and inelastic scattering, but one can calculate the separate contributions, as shown below. It is clear that, because of the increased path length and attenuation, the contribution of layer c is unimportant. The calculations show that the scattering from any phase is a linear function of the volume fraction of that phase in layer b. Thus, it is the blood volume fractions in layer b that are measured; the hematocrit involves volume fractions in layer b.
Hct=φ r/(φr+φp) [3]
EE=
IE=
EC=.0.313583−0.108563φr+0.045209φp
IC=(0.631030+14.83102φr+0.263197φp)×10−5
EE=
IE=
| TABLE 3 |
| Attenuation parameters of basic constituents of skin1,2,3 |
| μs (mm−1) | μa(mm−1) | |
| excitation wavelength 830 nm | |||
| plasma | 0.06 | 0.03 | |
| red blood cells (RBCs) | 30.0 | 0.45 | |
| static tissues | 1.20 | 0.5 | |
| excitation wavelength 805 nm | |||
| plasma | 0.061 | 0.0305 | |
| red blood cells (RBCs) | 31.0 | 0.45 | |
| static tissues(average skin) | 1.25 | 0.55 | |
| excitation wavelength 785 nm | |||
| plasma | 0.062 | 0.031 | |
| red blood cells (RBCs) | 32.0 | 0.45 | |
| static tissues(average skin) | 1.28 | 0.60 | |
| 1Salamotino, et al., J. Biomed. Opt. 11(6) 064026 (November/December 2006) | |||
| 2Jacques, OSA TOPS on Advances in Optical Imaging and Photon Migration, Vol. 2, pp. 364-369, eds. RR Alfano, JG Fujimoto, (Optical Society of America, 1996) | |||
| 3Meinke, et al., J. Biomed. Opt. 12(1) 014024 (January/February 2007) | |||
one obtains
where m is the length of the line PC and α+μ depends on z=t cos β because the attenuation coefficient is different in each layer. Taking all the above into account, the total detected radiation scattered from phase x is written as
where z=I cos θ in the first integral overt and z=t cos β in the second integral over t. The integral over I sums contributions from all points along the line OP (extended to a depth so that further contributions are negligible).
where h is 120 μm or 60 μm, x0 is the center (=7 μm, 607 μm, 1207 μm, etc.), w is the width (450 μm), and s is the shape parameter, equal to 30 μm. The values of the parameters are chosen to give the ridges and the valleys between them a shape close to what is actually observed. Starting at equally spaced values of x (−222 μm, −207 μm, −192 μm, etc.), and height 164 μm, the trajectory of the incoming ray is calculated at 53° to the vertical and where it intersects the profile and the angle θ′ it makes with the external normal to the profile at the point of intersection is determined. From θ′ one obtains θ and calculates the transmission coefficient T, using [1].
| TABLE 4 |
| In-vitro investigation of fluorescence and photobleaching properties |
| of some cutaneous and subcutaneous constituents of human skin tissue |
| Fluorescence/ | ||||
| Concentration | Photo-bleach | Source |
| Name | Solvent | Experimental | Physiological*[12] | ability | Manufacture | Cat. # |
| L-Glutathione | DI water | ×5**, ×25 | ≈1.09 | mM | N/N | Sigma-Aldrich | G4251 |
| Uric Acid | DI water | ×2, ×4 | 234-456 | μM | N/N | Aldrich | 16,118-7 |
| β-Carotene | Cyclohexane | /2**, /4, /25 | 1.23-1.75 | μM | N/N | Sigma | C9750 |
| Cholecalciferol | Cyclohexane | ×5, ×125, ×3125, | 40-80 | nM | N/N | Sigma | C9756 |
| ×78125 | |||||||
| L-Ascorbic acid | DI water | ×5, ×75, ×125, ×3125 | 50-60 | μM | N/N | Sigma | A5960 |
| (±)-α- | Cyclohexane | Stock**, /4, /25 | ≈24 | μM | N/N | Sigma | T3251 |
| Tocopherol |
| Gelatin | DI water | 0.5-7.5 | g/dL | N/A | Y/Y | Aldrich | 27,160-8 |
| Melanin | DI water | Stock, /2, /4 | Various | Y/Y | Sigma | M8631 |
| D-(−)-Ribose | DI water | 166 | mM | ≈13.2 | μM | N/N | Sigma | R7500 |
| L-Lysine | DI water | 171 | mM | ≈153 | μM | N/N | Aldrich | 16,971-4 |
| L-Arginine | DI water | 143 | mM | ≈57 | μM | N/N | Sigma-Aldrich | A5006 |
| Hemoglobin | DI water | 1.3-14.5 | g/dL | 12-17 | g/dL | Y/Y | Freshly harvested |
| Plasma | PBS | Stock, /2, /3, /4 | N/A | Y/N | Freshly harvested |
| *Physiological concentrations of constituents shown above are in blood, interstitial fluid or in skin. | |||||
| **Stock means saturated solution; ×5 means 5 times the physiological concentration; similarly, /2 means half the physiological or stock solution concentration. | |||||
Claims (27)
Priority Applications (3)
| Application Number | Priority Date | Filing Date | Title |
|---|---|---|---|
| US12/889,396 US8538499B2 (en) | 2009-09-23 | 2010-09-23 | Process and apparatus for non-invasive, continuous in vivo measurement of hematocrit |
| US14/027,804 US20140016117A1 (en) | 2009-09-23 | 2013-09-16 | Noninvasive, continuous in vitro simultaneous measurement of turbidity and concentration |
| US15/695,289 US11415511B2 (en) | 2009-09-23 | 2017-09-05 | Determination of turbidity using elastically and inelastically scattered light |
Applications Claiming Priority (2)
| Application Number | Priority Date | Filing Date | Title |
|---|---|---|---|
| US24502009P | 2009-09-23 | 2009-09-23 | |
| US12/889,396 US8538499B2 (en) | 2009-09-23 | 2010-09-23 | Process and apparatus for non-invasive, continuous in vivo measurement of hematocrit |
Related Child Applications (1)
| Application Number | Title | Priority Date | Filing Date |
|---|---|---|---|
| US14/027,804 Continuation-In-Part US20140016117A1 (en) | 2009-09-23 | 2013-09-16 | Noninvasive, continuous in vitro simultaneous measurement of turbidity and concentration |
Publications (2)
| Publication Number | Publication Date |
|---|---|
| US20110077496A1 US20110077496A1 (en) | 2011-03-31 |
| US8538499B2 true US8538499B2 (en) | 2013-09-17 |
Family
ID=43781100
Family Applications (1)
| Application Number | Title | Priority Date | Filing Date |
|---|---|---|---|
| US12/889,396 Active 2031-07-24 US8538499B2 (en) | 2009-09-23 | 2010-09-23 | Process and apparatus for non-invasive, continuous in vivo measurement of hematocrit |
Country Status (1)
| Country | Link |
|---|---|
| US (1) | US8538499B2 (en) |
Families Citing this family (7)
| Publication number | Priority date | Publication date | Assignee | Title |
|---|---|---|---|---|
| US20150018642A1 (en) * | 2013-07-12 | 2015-01-15 | Sandeep Gulati | Tissue pathlength resolved noninvasive analyzer apparatus and method of use thereof |
| DE102014205535A1 (en) * | 2014-03-25 | 2015-10-01 | Siemens Aktiengesellschaft | Device and in vitro method for label-free imaging and analysis of cells and crystals in a biological sample |
| WO2016054079A1 (en) | 2014-09-29 | 2016-04-07 | Zyomed Corp. | Systems and methods for blood glucose and other analyte detection and measurement using collision computing |
| WO2017100280A1 (en) * | 2015-12-07 | 2017-06-15 | Joseph Chaiken | Time resolved near infrared remission spectroscopy for noninvasive in vivo blood and tissue analysis |
| US9554738B1 (en) | 2016-03-30 | 2017-01-31 | Zyomed Corp. | Spectroscopic tomography systems and methods for noninvasive detection and measurement of analytes using collision computing |
| US20210015425A1 (en) * | 2018-02-09 | 2021-01-21 | Gideon Health, Inc. | Portable hydration monitoring device and methods |
| CN113925504B (en) * | 2021-10-21 | 2024-02-13 | 浙江澍源智能技术有限公司 | Arterial blood Raman spectrum detection device and method based on pulse wave |
Citations (12)
| Publication number | Priority date | Publication date | Assignee | Title |
|---|---|---|---|---|
| US6044285A (en) | 1997-11-12 | 2000-03-28 | Lightouch Medical, Inc. | Method for non-invasive measurement of an analyte |
| US6223063B1 (en) | 1998-01-27 | 2001-04-24 | Lightouch Medical, Inc. | Method and device for tissue modulation |
| US6289230B1 (en) * | 1998-07-07 | 2001-09-11 | Lightouch Medical, Inc. | Tissue modulation process for quantitative noninvasive in vivo spectroscopic analysis of tissues |
| US6292686B1 (en) | 1998-04-24 | 2001-09-18 | Lightouch Medical, Inc. | Apparatus and method for thermal tissue modulation |
| US6352502B1 (en) | 1998-12-03 | 2002-03-05 | Lightouch Medical, Inc. | Methods for obtaining enhanced spectroscopic information from living tissue, noninvasive assessment of skin condition and detection of skin abnormalities |
| US6389306B1 (en) | 1998-04-24 | 2002-05-14 | Lightouch Medical, Inc. | Method for determining lipid and protein content of tissue |
| US6503478B2 (en) | 1999-01-13 | 2003-01-07 | Lightouch Medical, Inc. | Chemically specific imaging of tissue |
| US6524858B1 (en) * | 1999-03-31 | 2003-02-25 | Bayer Corporation | Single channel, single dilution detection method for the identification and quantification of blood cells and platelets in a whole blood sample using an automated hematology analyzer |
| US7050842B2 (en) | 2000-07-11 | 2006-05-23 | Lightouch Medical, Inc. | Method of tissue modulation for noninvasive measurement of an analyte |
| US20070177143A1 (en) | 2003-12-22 | 2007-08-02 | Joseph Chaiken | Process and device for determination of cell viability |
| US20080306363A1 (en) | 2005-01-06 | 2008-12-11 | Lightouch Medical, Inc. | Specialized Human Servo Device And Process For Tissue Modulation Of Human Fingerprints |
| US7664605B2 (en) | 2003-11-12 | 2010-02-16 | Lightouch Medical, Inc. | Absolute calibration process and device for a tissue modulated Raman spectrometer |
-
2010
- 2010-09-23 US US12/889,396 patent/US8538499B2/en active Active
Patent Citations (14)
| Publication number | Priority date | Publication date | Assignee | Title |
|---|---|---|---|---|
| US6377828B1 (en) | 1997-11-12 | 2002-04-23 | Lightouch Medical, Inc. | Method for non-invasive measurement of an analyte |
| US6044285A (en) | 1997-11-12 | 2000-03-28 | Lightouch Medical, Inc. | Method for non-invasive measurement of an analyte |
| US6223063B1 (en) | 1998-01-27 | 2001-04-24 | Lightouch Medical, Inc. | Method and device for tissue modulation |
| US6389306B1 (en) | 1998-04-24 | 2002-05-14 | Lightouch Medical, Inc. | Method for determining lipid and protein content of tissue |
| US6292686B1 (en) | 1998-04-24 | 2001-09-18 | Lightouch Medical, Inc. | Apparatus and method for thermal tissue modulation |
| US6289230B1 (en) * | 1998-07-07 | 2001-09-11 | Lightouch Medical, Inc. | Tissue modulation process for quantitative noninvasive in vivo spectroscopic analysis of tissues |
| US6352502B1 (en) | 1998-12-03 | 2002-03-05 | Lightouch Medical, Inc. | Methods for obtaining enhanced spectroscopic information from living tissue, noninvasive assessment of skin condition and detection of skin abnormalities |
| US6681133B2 (en) | 1998-12-03 | 2004-01-20 | Lightouch Medical, Inc. | Methods and apparatus for obtaining enhanced spectroscopic information from living tissue |
| US6503478B2 (en) | 1999-01-13 | 2003-01-07 | Lightouch Medical, Inc. | Chemically specific imaging of tissue |
| US6524858B1 (en) * | 1999-03-31 | 2003-02-25 | Bayer Corporation | Single channel, single dilution detection method for the identification and quantification of blood cells and platelets in a whole blood sample using an automated hematology analyzer |
| US7050842B2 (en) | 2000-07-11 | 2006-05-23 | Lightouch Medical, Inc. | Method of tissue modulation for noninvasive measurement of an analyte |
| US7664605B2 (en) | 2003-11-12 | 2010-02-16 | Lightouch Medical, Inc. | Absolute calibration process and device for a tissue modulated Raman spectrometer |
| US20070177143A1 (en) | 2003-12-22 | 2007-08-02 | Joseph Chaiken | Process and device for determination of cell viability |
| US20080306363A1 (en) | 2005-01-06 | 2008-12-11 | Lightouch Medical, Inc. | Specialized Human Servo Device And Process For Tissue Modulation Of Human Fingerprints |
Non-Patent Citations (5)
| Title |
|---|
| Barman, I. et al., "Turbidity-Corrected Raman Spectroscopy for Blood Analyte Detection", Anal. Chem, 2009, 81(11):4233-4240. |
| Chaiken, J. et al., "On probing human fingertips in vivo using near-infrared . . . " J. of Biomedical Optics, May/Jun. 2010, 15(3):037007-1-15. |
| Chaiken, J. et al., "Simultaneous, noninvasive observation of elastic scattering . . . ", J. of Biomedical Optics, Sep. /Oct. 2009, 14(5):050505-1-3. |
| Deng, Bin et al., "Direct noninvasive observation of near infrared photobleaching . . . " Proc. of SPIE, 7560: 75600P-1-11. |
| Lipson, J. et al., "Requirements for Calibration in Noninvasive Glucose Monitoring by Raman Spectroscopy", J. of Diabetes Science and Technology, 2009, 3(2):233-241. |
Also Published As
| Publication number | Publication date |
|---|---|
| US20110077496A1 (en) | 2011-03-31 |
Similar Documents
| Publication | Publication Date | Title |
|---|---|---|
| EP1094746B1 (en) | Tissue modulation process for quantitative noninvasive in vivo spectroscopic analysis of tissues | |
| Delbeck et al. | Non-invasive monitoring of blood glucose using optical methods for skin spectroscopy—Opportunities and recent advances | |
| US6615061B1 (en) | Optical sensor having a selectable sampling distance for determination of analytes | |
| US8538499B2 (en) | Process and apparatus for non-invasive, continuous in vivo measurement of hematocrit | |
| Do Amaral et al. | Current development in non-invasive glucose monitoring | |
| Vashist | Non-invasive glucose monitoring technology in diabetes management: A review | |
| US20080255433A1 (en) | Optoacoustic monitoring of multiple parameters | |
| JP2003510556A (en) | Non-invasive sensor capable of determining optical parameters of a sample with multiple layers | |
| JP2021515638A (en) | Tissue measurement sensor | |
| Chaiken et al. | Analyzing near-infrared scattering from human skin to monitor changes in hematocrit | |
| Kyriacou et al. | The origin of photoplethysmography | |
| Dunaev | Wearable devices for multimodal optical diagnostics of microcirculatory-tissue systems: application experience in the clinic and space | |
| McMurdy et al. | Photonics‐based In Vivo total hemoglobin monitoring and clinical relevance | |
| EP1629767B1 (en) | Quantitative analyzer using a calibration curve | |
| Boatemaa et al. | Non-invasive glucose estimation based on near infrared laser diode spectroscopy | |
| RU2633494C2 (en) | Biosensor for non-invasive optical monitoring of biological tissues pathology | |
| Lychagov et al. | Noninvasive Hemoglobin Measurements With Photoplethysmography in Wrist | |
| Välisuo | Optical methods for assessing skin flap survival | |
| Dremin et al. | In vivo fluorescence measurements of biological tissue viability | |
| He et al. | Optoacoustic skin mesoscopy opens a window to systemic effects of diabetes | |
| Hou et al. | Noninvasive in vivo study of NADH fluorescence and its real-time intrinsic dynamical changes: Experiments and seven-layered skin model Monte Carlo simulations | |
| Udara et al. | DiabiTech-non-invasive blood glucose monitoring system | |
| Chaiken et al. | Analyzing near infrared scattering from human skin to monitor changes in hematocrit | |
| Haroon et al. | Design and development of non-invasive prototype to measure pulse rate, blood glucose and oxygen saturation level in arterial blood | |
| Zherebtsov et al. | Impact of blood volume on the diffuse reflectance spectra of human skin in visible and NIR spectral ranges |
Legal Events
| Date | Code | Title | Description |
|---|---|---|---|
| AS | Assignment |
Owner name: LIGHTOUCH MEDICAL, INC., PENNSYLVANIA Free format text: ASSIGNMENT OF ASSIGNORS INTEREST;ASSIGNOR:CHAIKEN, JOSEPH;REEL/FRAME:025043/0006 Effective date: 20100923 |
|
| STCF | Information on status: patent grant |
Free format text: PATENTED CASE |
|
| AS | Assignment |
Owner name: SYRACUSE UNIVERSITY, NEW YORK Free format text: NUNC PRO TUNC ASSIGNMENT;ASSIGNOR:CHAIKEN, JOSEPH;REEL/FRAME:040668/0576 Effective date: 20161216 Owner name: SYRACUSE UNIVERSITY, NEW YORK Free format text: NUNC PRO TUNC ASSIGNMENT;ASSIGNOR:CHAIKEN, JOSEPH;REEL/FRAME:040668/0487 Effective date: 20161216 |
|
| REMI | Maintenance fee reminder mailed | ||
| FEPP | Fee payment procedure |
Free format text: SURCHARGE FOR LATE PAYMENT, SMALL ENTITY (ORIGINAL EVENT CODE: M2554) |
|
| MAFP | Maintenance fee payment |
Free format text: PAYMENT OF MAINTENANCE FEE, 4TH YR, SMALL ENTITY (ORIGINAL EVENT CODE: M2551) Year of fee payment: 4 |
|
| FEPP | Fee payment procedure |
Free format text: MAINTENANCE FEE REMINDER MAILED (ORIGINAL EVENT CODE: REM.); ENTITY STATUS OF PATENT OWNER: SMALL ENTITY |
|
| FEPP | Fee payment procedure |
Free format text: 7.5 YR SURCHARGE - LATE PMT W/IN 6 MO, SMALL ENTITY (ORIGINAL EVENT CODE: M2555); ENTITY STATUS OF PATENT OWNER: SMALL ENTITY |
|
| MAFP | Maintenance fee payment |
Free format text: PAYMENT OF MAINTENANCE FEE, 8TH YR, SMALL ENTITY (ORIGINAL EVENT CODE: M2552); ENTITY STATUS OF PATENT OWNER: SMALL ENTITY Year of fee payment: 8 |