Map of upper house elections: Democrats gained control Democrats retained control Republicans retained control Coalition gained control Non-partisan legislature No regularly-scheduled elections
Map of lower house elections: Democrats gained control Democrats retained control Republicans gained control Republicans retained control Non-partisan legislature No regularly-scheduled elections
The 2006 United States state legislative elections were held on November 7, 2006, halfway through PresidentGeorge W. Bush's second term in office. This election was a wave elections in the United States election, and saw Democrats simultaneously reclaim both houses of Congress and pick up six governorships. Elections were held for 90 legislative chambers, with all states but Louisiana, Mississippi, New Jersey, and Virginia holding elections in at least one house. Kansas, New Mexico, and South Carolina held elections for their lower, but not upper house. Four territorial chambers in three territories and the District of Columbia were up, including the newly created territorial legislature in the U.S. Virgin Islands.
Regularly-scheduled elections were held in 90 of the 99 state legislative chambers in the United States. Nationwide, regularly-scheduled elections were held for 6,343 of the 7,383 legislative seats. Many legislative chambers held elections for all seats, but some legislative chambers that use staggered elections held elections for only a portion of the total seats in the chamber.[3] The chambers not up for election either hold regularly-scheduled elections in odd-numbered years, or have four-year terms and hold all regularly-scheduled elections in presidential midterm election years.
Note that this table only covers regularly-scheduled elections; additional special elections took place concurrently with these regularly-scheduled elections.
Early in the election cycle, analysts considered Democrats to have an advantage over Republicans, despite both parties controlling a similar number of competitive legislative chambers. The unpopularity of PresidentGeorge W. Bush, as well as a number of Republican governors, made the party vulnerable to losses in legislatures across the country, with Democrats looking to build on the gains they made in the 2004 elections. In addition to targeting many Republican-held chambers considered imminently vulnerable in 2006, Democrats also sought to make gains in more solidly-Republican chambers, such as the New York State Senate and Ohio House of Representatives, with the hopes of flipping them in 2008.[4] As the cycle progressed, local political factors shifted projections for multiple chambers, usually in the Democrats' favor.[5][6]
Ratings are designated as follows:
"Tossup": Competitive, no advantage
"Lean": Competitive, slight advantage
"Likely": Not competitive, but opposition could make significant gains
All of the seats of the Alaska House of Representatives and half of the Alaska Senate were up for election. A Democratic-led coalition established control of the Senate while Republicans maintained control of the House.
All of the seats of the Delaware House of Representatives and half of the Delaware Senate were up for election. Democrats maintained control of the Senate while Republicans maintained control of the House.
All of the seats of the Indiana House of Representatives and half of the Indiana Senate were up for election. Republicans maintained control of the Senate while Democrats gained control of the House of Representatives.
All of the seats of the Iowa House of Representatives and half of the Iowa Senate were up for election. Democrats gained control of both state legislative chambers.
All of the seats of the Kentucky House of Representatives and half of the Kentucky Senate were up for election. Republicans maintained control of the Senate and Democrats maintained control of the House of Representatives.
All of the seats of the Michigan Legislature were up for election. Republicans maintained control of the Senate while Democrats won control of the House of Representatives.
All of the seats of the Montana House of Representatives and half of the Montana Senate were up for election. Democrats maintained control of the Senate and Republicans flipped control of the House.
Nebraska is the only U.S. state with a unicameral legislature; half of the seats of the Nebraska Legislature were up for election. Nebraska is also unique in that its legislature is officially non-partisan and holds non-partisan elections, although the Democratic and Republican parties each endorse legislative candidates. Republicans maintained control.
All of the seats of the Nevada House of Representatives and half of the Nevada Senate were up for election. Democrats maintained control of the House while Republicans maintained control of the Senate.
All of the seats of the New York Legislature were up for election. Republicans maintained control of the Senate while Democrats maintained control of the Assembly.
All of the seats of the Oklahoma House of Representatives and half of the Oklahoma Senate were up for election. Democrats maintained effective control of the newly-tied Senate with the Lieutenant Governor's tie-breaking vote, although both parties elected a co-president of the Senate. Republicans maintained control of the House.
All of the seats of the Oregon House of Representatives and half of the Oregon Senate were up for election. Democrats maintained control of the Senate and won control of the House.
All of the seats of the Pennsylvania House of Representatives and half of the Pennsylvania Senate were up for election. Republicans maintained control of the Senate while Democrats won control of the House of Representatives.
All of the seats of the Tennessee House of Representatives and half of the Tennessee Senate were up for election. Republicans maintained control of the Senate while Democrats maintained control of the House.
All of the seats of the Texas House of Representatives and half of the Texas Senate were up for election. Republicans maintained control of both state legislative chambers.
All of the seats of the Utah House of Representatives and half of the Utah Senate were up for election. Republicans maintained control of both state legislative chambers.
All of the seats of the Wisconsin Assembly and half of the Wisconsin Senate were up for election. Democrats won control of the Senate while Republicans maintained control of the Assembly.
All of the seats of the American Samoa Senate and the American Samoa House of Representatives were up for election. Members of the Senate serve four-year terms, while members of the House of Representatives serve two-year terms. Gubernatorial and legislative elections are conducted on a nonpartisan basis in American Samoa.
All of the seats of the unicameral Legislature of Guam were up for election. All members of the legislature serve a two-year term. Republicans retained control of the legislature.
All of the seats of the unicameral Legislature of the Virgin Islands were up for election. All members of the legislature serve a two-year term. Democrats won control of the newly created legislature.
^The Iowa Senate was evenly split prior to the election. Thus it is not included in the prior total.
^The Alaska Senate was controlled by a coalition of Democrats and Republicans. The minority caucus consists of Republicans who were not part of the majority coalition.
^ abcdefghThe upper houses of Arkansas, Delaware, Florida, Hawaii, Illinois, Minnesota, New Jersey, and Texas use a 2-4-4 term length system.
^ abcThese figures represent the seats of Nebraska's unicameral legislature.
^ abThe Democratic Party controlled the chamber by virtue of holding the governor's office.


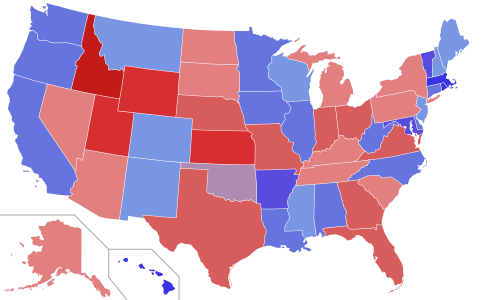 Upper house seats by party holding majority in each state
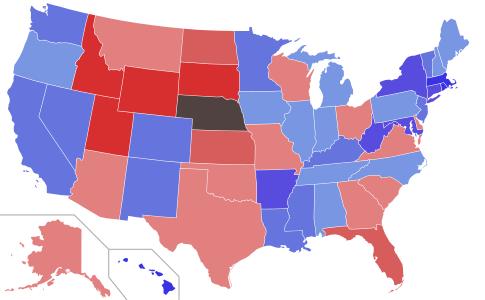 Lower house seats by party holding majority in each state
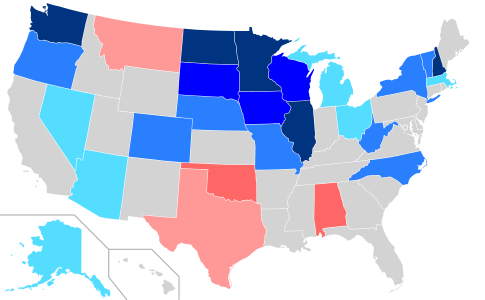 Net changes to upper house seats after the 2006 elections
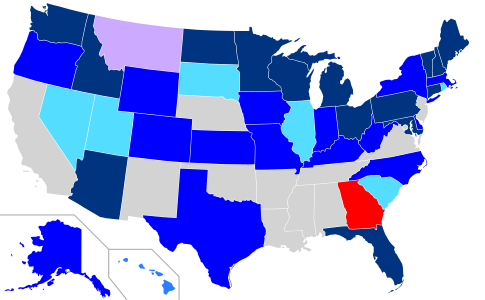 Net changes to lower house seats after the 2006 elections


