skip to main content
research-article
Open access

Improved Security for Multimedia Data Visualization using Hierarchical Clustering Algorithm

Published: 12 September 2024 Publication History

Abstract

In this paper, a realization technique is designed with a unique analytical model for transmitting multimedia data to appropriate end users. Transmission of multimedia data to all end users through a variety of visualization methods is the foundation of future computer systems. Yet, highly limited system resources prevent the updating of the methods used to manage multimedia data. Hence, a high-end visualization technique where uncertainties are eliminated is required for the visualization process with a multimedia system. As a result, the suggested system incorporates a clustering technique utilizing an analytical framework to ensure a high degree of transmission for all multimedia data. The technical contribution of the proposed method depends on a multimedia visualization process that takes place with high security features by including necessary parametric relationships such as occurrence of jitter, data density points, time period, multimedia storage, data smoothness and distance. For the established parametric relationship the validation methodology is integrated with a hierarchical clustering algorithm, thereby transmitting every clustered data with high security feature, thereby the examined outcomes under five scenarios proves that data security which is represented by simulation outcomes is improved to 88% as compared to the existing approach.

1 Introduction

In current generation data path configurations there are a high number of users and registered users are also higher where there is a high possibility that queuing process is followed. The scientific problem that is present in existing methods for multimedia data visualization is that feature points that must be added as a main task for enhancing security features are not examined. Further, the existing approach involves a higher number of variables, therefore the process of data evaluation in multimedia systems is much more complex in web surfaces. Even if variable functions are solved, the entire sequence and volume interferences are much more higher in multimedia visualization and it cannot be handled without the presence of algorithmic constraint. It is also observed that for taking decisions based on variables some of the data needs to be represented in a simple way, thereby misleading visualizations can be prevented. But most of the researchers have developed the visualization process that includes more amounts of data without considering the above-mentioned scientific problem. The process of data transmission using a queuing technique provides a high-end delay to all users in the network. Due to a delay in data processing many multimedia systems are affected due to low visualization capability, and as a result contract replication takes place. To avoid such contractions in the visualization process, a unique procedure using analytical models is proposed with clustering techniques. Since visualization techniques are much better in terms of static visualization process it is essential to provide better standards to multimedia data as compared to standard data techniques. The proposed method increases the quality of multimedia data to a large extent, thus appropriate standards are defined with a multiple realization technique.
One of the major advantages of multiple realization with multimedia data is that information that are related to any physical phenomenon can be determined in an easy way. As a result of much simpler determination the collective data that is represented in the system changes and other challenging tasks also arise during collective data representations. Due to collective data there are some problems with allocation of resources in the entire system, but it is possible to resolve such issues if multimedia data is separated using a clustering procedure. In case a visualization technique is chosen, then the statistical difference for visualization must be determined thus providing a quick learning outcome in multimedia representation systems. The block diagram of the proposed model with clustering procedure is represented in Figure 1. The block diagram representation in Figure 1 uses the contents of multimedia systems where discrepancies are identified completely. After the above-mentioned discrepancies, segmentation of data is changed with more divisions that are allocated for learning segments. The learning process detects the type of multimedia data where text, audio and video segments are separated using a clustering algorithm. Moreover, during this segmentation hierarchical clustering is used in order to extract data from different users, thus generating a clustered pattern with a data discovering module. If the data is discovered then visualization time period of the signal starts in wireless form, thus all necessary data is stored in the system by using a cloud system. At the last stage, all multimedia data will be tested in the cloud platform itself where the entire output is visualized using output units with management applications.
Fig. 1.
Fig. 1. (a) Block diagram for visualization of multimedia data (b) Process of multimedia data visualization and clustering.

1.1 Major Contributions

The major contributions of the proposed method are based on enhancing the security features of multimedia data where every incorporated data is enhanced using a hierarchical clustering algorithm. Hence, the major contributions are based on evaluating basic parameters that are related to the proposed system model as follows.
To separate the data into segments by following the hierarchical order during the transmission process, thereby maintaining constant density function with the visualization matrix.
To reduce the waiting time period after transmitting multimedia data with represented hierarchy and to prevent jitter that is present in separated data.
To minimize the amount of data delay and distance with a maximization of storage capacity in order to increase the security in the same storage block.

1.2 Research Gap and Motivation

Most of the existing methods that are discussed for multimedia representations focus on different data segment features where at the initial state of representation the visualization process is not represented as a primary objective. Instead of visualization where data needs to be searched throughout the entire period only arrival times are determined, thus leading to a low secured state. Additionally, if the data is separated as clusters in several transmission areas, then data security must be maximized at a low delay rate. But the multimedia data clusters are formed as individual groups with separate density representation values thereby high power is consumed for all fabricated nodes. Even if clusters are formed, the multimedia data arrival rate is reduced which is observed from reference time period representations.
Therefore, to overcome the gap that is mentioned above in all existing methods, the proposed method is designed with a unique multimedia transmission technique by maximizing the density of each data before passing inside the channel. During this transmission process reference time period is observed and compared with time of arrival at each cluster region which is minimized as compared to the existing method.

1.3 Structure

The rest of the paper is organized as follows: Section 2 describes the related information on background and related works. Section 3 formulates the multimedia visualization problem with parametric representations as the proposed system model. Section 4 integrates the hierarchical clustering algorithm with the system model by following step-by-step implementations. Section 5 examines the real time results and provides discussion on designed case studies and finally, Section 6 concludes the paper with directions on future work.

2 Background and Related Works

An extensive literature survey of existing article provides deep insight about all multimedia applications that are transmitted in any form. Therefore, relevant models are chosen for having deep knowledge about processing techniques. Also, the multimedia applications are based on new formulations where basic mathematical knowledge is needed therefore the basic formulations are stated using the existing case studies. Even formation of objectives where portions of multimedia case studies are left over is analyzed with discussion on major advantages and disadvantages. In [1] a parallel series method is chosen for deriving multimedia data which is termed as replication of data segments. During this replication process a closed loop equation is framed for determining the number of servers to transmission and reception of multimedia signals. However, if closed loop equations are framed then the representation status of signals is a much more difficult task, hence it is completely avoided in modernized system. To solve the closed loop problem a visualization survey has been made by focusing different techniques with ensemble data [2]. If ensemble data is incorporated, then the multimedia systems respond to a clear operating status but the operation will be directly converted as conventional form. The major drawback in conventional form is that the users are not allowed to transmit data in the original form that they are forming but at the receiver side the data can be reconstructed. In order to make the data to be transmitted in original form a monitoring system is created for multimedia applications and for examination case it is directly applied to health care applications [3]. Moreover, it is observed that multimedia applications provide great support towards health care but requires only a local binary pattern where the images are transferred to other user ends.
The multimedia systems must always be modernized with current technological solutions, thus a buffer-based technique is introduced in many applications for temporary storage of data [4]. If buffer is used in multimedia applications, then quality of service is increased with reduction in delay. However, all stored data can be removed at any point from the system, hence a temporary solution can only be achieved. Conversely, many researchers tried to build a multimedia system that provides permanent solution for several problems during visualization process by allocating proper resources to contents that are transferred [5]. Even though allocation of resources are proper, an appropriate network support is needed in this case therefore an offloading system is enabled in the procedure at high cost factor. Further, to reduce the cost involved in the process a wireless system for multimedia applications is arranged at the user end [6]. As a result of proper arrangements synchronization is made in voice systems but identification of such cases is a very monotonous task due to the presence of matching models in the system. Also, the major drawback of the above-mentioned application is that voice must be clearly implicit by users through effective transmission if three dimensional designs are made. In addition, there will be separate cases that are made through high dimensional cases, therefore a chaos algorithm must be chosen with strong key performance [7] where mapping of multimedia signals takes place. Nevertheless, the mapping procedures provide a static observation of multimedia signals, but it takes into effect the number of available encryption types in the system.
Even in business applications the roles of multimedia applications are wide ranging and diverse in nature [8], thus making a better decision-making mechanism without any interpretation. The decision-making mechanism can be directly related to the Internet of Things storage process as high configurable patterns can be received without any interference from other users. Due to this direct linkage, multimedia application in any form can be stored in the cloud platform and it is also freely accessible in nature. Even though appropriate linkage process is made the data resources are not properly distributed in multimedia applications and as a result resources are reduced in the system. In order to check with a resource allocation technique, an overview is made with fusion and analysis technique [9], thus affirming future extraction process with outlier decision mechanism. If such decision mechanisms are introduced, then multimedia computing will change into risky process thus it is avoided in the near future. Even if it is endeavored, the volume of multimedia traffic results as a challenging task at analytics stage thus immediate decision mechanisms are completely avoided. As an alternate model to decision making, a cluster analysis scheme is proposed in the system with a multi visualization perspective [10], thus carrying analysis on big data and networks. However, multiple visualization provides a cost-effective model and in case any are distributed in a local medium then it multimedia data will be affected completely.
To overcome the aforementioned drawback more information about moving objects is chosen and integrated in the system using segmentation algorithm [11]. Due to the presence of segmentation, entire data is distributed without any problem to other data in the picture, thus a physical realization is much easier to achieve. After achieving appropriate realizations decision mechanisms can be introduced in the system where low effect is observed if multimedia data is lost in corresponding segments. Furthermore, optimization segments are also created in teaching applications where data is transferred with input voice instead of a particular data [12]. But due to voice applications the sound of a signal remains under a highly noisy environment thus making the multicast members to be very limited. In addition, many techniques [1316] provide information of multimedia systems under different applications such as medical, transportation, and agriculture by using an image processing set. But all methods fail to express proper outcomes in terms of individual parametric values and analytical models are not defined. Therefore, to overcome the drawbacks of observed cases an analytical model is designed and described in subsequent section and key literature works are described in Table 1.
Table 1.
ReferencesMethods/AlgorithmsObjectives
  ABCDEF
[1]Parallel server visualization process  \(\checkmark\)   \(\checkmark\)   
[6]Comprehensive weighted algorithm for visualization \(\checkmark\)   \(\checkmark\)   \(\checkmark\)  
[8]Interactive decision making procedure  \(\checkmark\) \(\checkmark\)    \(\checkmark\)
[10]Clustering similarity measures \(\checkmark\)    \(\checkmark\)   \(\checkmark\)
[12]Application reserved multimedia technology  \(\checkmark\)     \(\checkmark\)
[16]Big data visualization procedure   \(\checkmark\) \(\checkmark\)   
[19]Authentication scheme for multimedia applications  \(\checkmark\)   \(\checkmark\)   \(\checkmark\)
ProposedBlock chain and hierarchical clustering for multimedia visualization \(\checkmark\) \(\checkmark\) \(\checkmark\) \(\checkmark\) \(\checkmark\) \(\checkmark\)
Table 1. State-of-the-Art: A Comparison
A: Identification of jitter; B: Multimedia data utilization; C: Data storage capacity; D: Identification of sleekness; E: Density representations; F: Secured transactions and visualizations.

3 Proposed System Model

The analytical model of multimedia systems for IoT applications is designed in a particular way where it provides a clear insight of operational conditions in real time conditions. In addition, the mathematical representation of a process defines the appropriate way of data transfer and control strategies in entire system. Moreover, if a multimedia operation is present then multicast of data is represented using visualization process, thus high-cost systems such as reality techniques are not used in system representation. In initial period the visualization data starts by examining the density of users that is formulated using Equation (1) as follows,
\begin{equation} {{\rm{d}}}_{\rm{i}} = \mathop \sum \limits_{{\rm{i}} = 1}^{\rm{n}} \frac{{4{{\rm{m}}}_{{\rm{dp}}}\left( {\rm{i}} \right)}}{{\left| {{\rm{d}}{{\rm{p}}}_{\rm{i}}} \right|}} \end{equation}
(1)
Where,
\(4{\rm{m}}\) indicates for different parametric visualization matrix.
\({\rm{d}}{{\rm{p}}}_{\rm{i}}\) denotes data point density of both transmitter and receiver.
The data arrival rate of four different matrices with visualization representation is measured using arrival rate where in case if the multimedia data in the system is less observable then visualization of data without any withdraw terms is represented using Equation (2) as follows,
\begin{equation} 4{{\rm{m}}}_{{\rm{dp}}}\left( {\rm{i}} \right) = \mathop \sum \limits_{{\rm{i}} = 1}^{\rm{n}} {{\rm{\delta }}}_{\rm{i}}\left( {1 - {\vartheta }_{\rm{i}}} \right) \end{equation}
(2)
Where,
\({{\rm{\delta }}}_{\rm{i}}\) denotes waiting time of multimedia packet arrival.
\({\vartheta }_{\rm{i}}\) indicates the time period of data withdrawal.
The amount of waiting time in Equation (2) is also denoted using delay period in multimedia system where visualization of data is not in appropriate form. Thus, the jitter in multimedia data for IoT is represented using Equation (3) as follows,
\begin{equation} {{\rm{\tau }}}_{\rm{i}} = {\rm{min}}\mathop \sum \limits_{{\rm{i}} = 1}^{\rm{n}} {{\rm{d}}}_{\rm{n}}\left( {\rm{i}} \right) + {\rm{a}}{{\rm{d}}}_{\rm{n}}\left( {\rm{i}} \right) \end{equation}
(3)
Where,
\({{\rm{d}}}_{\rm{n}}\) , \({\rm{a}}{{\rm{d}}}_{\rm{n}}\) denotes amount of visualization delay and average delay in the network.
Equation (3) is termed as minimization objective process which is used for summation terms in multimedia application network. However, the entire data visualization process does not depend on two parametric values alone. Therefore, utilization period of multimedia network must be defined and it is formulated using Equation (4) as follows,
\begin{equation} {{\rm{u}}}_{\rm{i}} = {\rm{min}}\mathop \sum \limits_{{\rm{i}} = 1}^{\rm{n}} {{\rm{t}}}_{\rm{i}}\ast {{\rm{s}}}_{\rm{d}}\left( {\rm{i}} \right) \end{equation}
(4)
Where,
\({{\rm{t}}}_{\rm{i}}\) denotes time period of visualizing a particular data.
\({{\rm{s}}}_{\rm{d}}\) represents degree of multimedia data representation.
Equation (4) denotes the secondary minimization of utilization framework where the time period of implementing a visualization case is represented using Equation (5) as follows,
\begin{equation} {{\rm{t}}}_{\rm{i}} = \mathop \sum \limits_{{\rm{i}} = 1}^{\rm{n}} \frac{{{{\rm{p}}}_{\rm{i}}}}{{{\rm{capacit}}{{\rm{y}}}_{\rm{i}}}} \end{equation}
(5)
Where,
\({{\rm{p}}}_{\rm{i}}\) indicates power consumption of nodes.
\({\rm{capacit}}{{\rm{y}}}_{\rm{i}}\) denotes maximum allocated capacity of multimedia devices.
Since the proposed system is designed for IoT applications it is essential to determine a storage model that is suitable for visualization process. Hence, Equation (6) is formulated using an access point as given below,
\begin{equation} {\rm{c}}{{\rm{s}}}_{\rm{i}} = {\rm{max}}\mathop \sum \limits_{{\rm{i}} = 1}^{\rm{n}} {{\rm{b}}}_{\rm{i}}\left( {\frac{{{{\rm{p}}}_{\rm{i}}\ast {{\rm{g}}}_{\rm{i}}}}{{{{\rm{n}}}_0}}} \right) \end{equation}
(6)
Where,
\({{\rm{b}}}_{\rm{i}}\) indicates node bandwidth.
\({{\rm{g}}}_{\rm{i}}\) represents gain of visualization channels.
\({{\rm{n}}}_0\) denotes noise in the multimedia data.
The maximization problem is framed using amount of power in the network without any normalization procedure. But to attain a stable multimedia network a smoothness function is introduced as defined in Equation (7) as follows,
\begin{equation} {{\rm{\mu }}}_{\rm{i}} = {\rm{min}}\mathop \sum \limits_{{\rm{i}} = 1}^{\rm{n}} {\rm{weigh}}{{\rm{t}}}_{\rm{i}}\left( {{\rm{b}},{\rm{a}} + {\rm{x}},{\rm{y}}} \right) \end{equation}
(7)
Where,
\({\rm{b}},{\rm{a}},{\rm{x}},{\rm{y}}\) denotes four independent visualization weight matrices.
The objective function of the proposed method is represented as a combined equation of minimization and maximization measures as mentioned earlier. Therefore, the objective function is formulated using Equation (8) as follows,
\begin{equation} {\rm{Ob}}{{\rm{j}}}_1 = {\rm{min}}\mathop \sum \limits_{{\rm{i}} = 1}^{\rm{n}} {{\rm{\tau }}}_{\rm{I}},{{\rm{\mu }}}_{\rm{I}},{{\rm{u}}}_{\rm{I}} \end{equation}
(8)
\begin{equation} {\rm{Ob}}{{\rm{j}}}_2 = {\rm{max}}\mathop \sum \limits_{{\rm{i}} = 1}^{\rm{n}} {\rm{c}}{{\rm{s}}}_{\rm{i}} \end{equation}
(9)
Equations (8) and (9) represent the multiple objective functions where minimization and maximization problems are separated. The objective function in Equation (8) is only the analytical equation that is used for design process in the system. But to achieve high efficiency for multimedia applications and optimization algorithm is integrated with above mentioned system modes which is described in Section 3.

4 Optimization Algorithms

In multimedia application visualization processes it is essential to minimize the time period of data transmission between two user ends, therefore an optimization algorithm that reduces the time of transmission is chosen. Moreover, due to different types of data processing that are not recognized by users an automatic transmission system using artificial intelligence algorithm is chosen. To be more specific, multimedia applications functions in an effective way if clustering segments are introduced as different types of data in the form of video, text and audio systems needs to be transmitted without any collision [1719]. In the proposed method one best type of clustering termed as Hierarchical Clustering Algorithm (HCA) is chosen where no prior information about data types is needed in the system. In addition, HCA is much suitable for integration with defined analytical model as there will be sudden increase in traffic conditions, thus to handle such uncertainty situations no prior information is needed [2022]. Also once the data is processed at transmitted side it is not possible to modify any multimedia content thus giving high security features at hidden cost. The mathematical model of HCA is formulated as follows,
\begin{equation} {{\rm{d}}}_{\rm{f}}\left( {\rm{i}} \right) = \mathop \sum \limits_{{\rm{i}} = 1}^{\rm{n}} {{\rm{f}}}_{\rm{b}}\left( {\rm{z}} \right) \end{equation}
(10)
Where,
\({{\rm{f}}}_{\rm{b}}( {\rm{z}} )\) represents approximation function.
Equation (9) provides information on modified density function in the defined interval periods where near points are marked for multimedia data transmission. Due to this mark points there is a high possibility that error will occur in the density function that is defined using Equation (10) as follows,
\begin{equation} {{\rm{e}}}_{\rm{i}} = {\rm{min\ }}\mathop \sum \limits_{{\rm{i}} = 1}^{\rm{n}} \frac{{{\rm{dist}}\left( {{{\rm{z}}}_{\rm{i}} - {\rm{z}}} \right)}}{{{\partial }^2}} \end{equation}
(11)
Where,
\({{\rm{z}}}_{\rm{i}}\) , \({\rm{z}}\) represents marked points in multimedia systems.
\({\partial }^2\) denotes derivative of error functions.
The error function in Equation (10) defines that distance between multimedia points must be minimized using attractive function values. These attractive functions are defined using linkage cluster points as given in Equation (11).
\begin{equation} {{\rm{\omega }}}_{\rm{i}} = \mathop \sum \limits_{{\rm{i}} = 1}^{\rm{n}} \frac{{{{\rm{d}}}_{\rm{w}}\left( {{{\rm{z}}}_{\rm{i}}} \right) + {{\rm{d}}}_{\rm{w}}\left( {\rm{z}} \right)}}{2} \end{equation}
(12)
Where,
\({{\rm{d}}}_{\rm{w}}( {{{\rm{z}}}_{\rm{i}}} )\) , \({{\rm{d}}}_{\rm{w}}( {\rm{z}} )\) describes the distance between two arbitrary selected points.
Equation (11) represents the distance between spatial points but in multimedia applications there is a possibility that non-spatial distance points is present using time periods. Thus, non-spatial distance point is represented using Equation (12) as follows,
\begin{equation} {{\rm{\omega }}}_{\rm{i}}\left( {{\rm{NS}}} \right) = \mathop \sum \limits_{{\rm{i}} = 1}^{\rm{n}} {\rm{abs}}\left( {{\rm{tim}}{{\rm{e}}}_{{\rm{ref}}} - {\rm{tim}}{{\rm{e}}}_1} \right) \end{equation}
(13)
Where,
\({\rm{tim}}{{\rm{e}}}_{{\rm{ref}}}\) , \({\rm{tim}}{{\rm{e}}}_1\) indicates the reference and original time periods.
The primary reason for integrating HCA in the proposed system model is that there is no need to pre-specify any type of data in the representation system. If HCA is introduced then automatic dendrogram will be represented at the output therefore the complexity of data visualization will be reduced. Further, HCA measures the nearby distance of all data and group the required data hence the data can be visualized to end users even if they are located at long distances. Moreover, the convergence that describes the representation of stable visualization points is guaranteed in HCA as compared to other complex algorithms and as a result the handling capacity of HCA in case of data visualization is much smoother and fair representations are achieved within short period of time.
The absolute difference between two time periods must be minimized thus all data in multimedia applications is transmitted at minimum time periods. The step-by-step approach of HCA is as illustrated in Figure 2. Figure 2 indicates the implementation steps of multimedia data visualization that is integrated with hierarchical clustering algorithm where initialization is based on representing a visual matrix with four independent functions that are separated by density matrix. As the data is separated without any label representation the waiting time period before data transmission is indicated in the next state therefore the rising delays are minimized. If the delay values are minimized then it is possible to visualize the segmented data by end users but for transmission to every end user the power factor must be checked. It is always necessary that appropriate power must be provided with respect to distance point of view and in the proposed method the power is minimized according to considered distance. If the above-mentioned system parameters for multimedia data visualization is optimized then the data is arranged in hierarchical order with cluster representations thus adding additional security to every cluster. All the clustered data is transmitted and the total time period of transmission is examined and minimized in proposed method. Therefore, every user is able to visualize the data at reduced time period without any delay.
Fig. 2.
Fig. 2. Multimedia data processing using AI.

5 Experimentation, Result and Analysis

The process of experimental verification is described in this section using AI visualization process where the outcomes are validated using different multimedia data set representation. At the initial case the number of servers that are distributed for multimedia operation changes if large network size is present. However, the real time experimentation is carried out using a low number of multimedia data, therefore the time period of execution is also reduced. Further, four different parametric matrixes are chosen as the entire data structure is different from standard structure and in addition the channel noise will be completely avoided in the system if parametric values are changed for multimedia records. Moreover, an approximation function is defined with absolute parametric values that provide additional advantage in case of outcome evaluation. The hardware setup of visualization is arranged in such a way that error functions are observed and removed from the system. Once the errors are removed then it is much easier to set up the simulation path with individual weight matrix functions. Hence, four variables are chosen for defining the input data weights but in the proposed method waiting time of each input weights are also defined in a unique way unlike other data representations. Additionally, the outcomes that are simulated must be visualized in real time with comparison metrics therefore MATLAB representations are chosen for multimedia data. In order to observe the outcomes in a unique way five scenarios are considered according to the defined analytical model as follows,
Scenario 1: Representation of jitter
Scenario 2: Utilization period of multimedia data
Scenario 3: Depiction of multimedia storage model
Scenario 4: Determination of sleekness
Scenario 5: Discernable density points

5.1 Discussions

All the above-mentioned scenarios are performed in a unique way using multimedia data loop representations and the degree of replications are used for choosing uncertainties in input data. Hence, as a result all errors are reduced at the input stage itself thus making clear information to all users about the type of information that needs to be sent to another device either in the same or different areas. The detailed description of all scenarios is as follows:
Scenario 1. If a multimedia system is represented with more amounts of data in the form of voice signals or even with text signatures, then there is a possibility that jitter will occur in corresponding multimedia signals and it must be minimized. In the proposed method jitter is measured in terms of delay that represents the lag in time period for making the data to reach the receiver. Moreover, the above-mentioned delay factor is present due to two major reasons where the entire network faces a common delay in transmitting a multimedia data. In the second case the delay occurs only in the visualization outputs thus making all input data to result in failure case. Therefore, total jitter values are measured by summing up individual delay at visualization stage and total delay in the network. One of the most common ways to reduce delay in the network is to incorporate a system that process multimedia data using separate channels and in this way there will be a high possibility that all data will be transmitted at appropriate time periods. Figure 3 provides simulated outcome of delay periods.
Fig. 3.
Fig. 3. Comparison of jitter representations.
Figure 3 and Table 2 provide a simulation model where five different multimedia data are transmitted and during this transmission period the ensuing visualization delays such as 1.14, 1.19, 1.25, 1.3 and 1.37 is maintained. In addition, individual delays in the network are observed to be 0.7, 0.8, 1, 1.07 and 1.1, respectively, and all the delays are taken at medium level amount in proposed system. By using the above-mentioned delay values a comparison case is examined and represented in terms of jitter. During comparison case it is observed that proposed method provides very low jitter values as compared to the existing method [6]. This can be verified with visualization delay of 1.37 seconds with total delay of 1.1 seconds and during this delay periods the amount of jitter in the proposed method is 13% whereas the percentage of jitter for existing case remains at 36%.
Table 2.
Visualization delayAverage delayPercentage of jitter [6]Percentage of jitter (Proposed)
1.140.72415
1.190.82617
1.2513014
1.31.073413
1.371.13613
Table 2. Percentage of Jitter with Delay Periods
Scenario 2. The multimedia data systems are represented using a certain degree in order to distinguish it from standard signal representations. However, the degree of realization depends on the type of data that is transmitted in the system. In case if a speech signal is transmitted, then 35 different degrees of representations can be made using modulation process. Therefore, it is not possible to get an accurate degree of reading and understanding, thus the utilization period of multimedia signals are measured in this scenario. In the proposed method utilization period denotes the maximum amount that a degree of multimedia data is present in the system and total time taken to visualize a particular data that is transmitted. The above-mentioned summation terms provides total change in utilization period which is simulated and shown in Figure 4. Even the utilization period can be calculated using delay terms but in most cases accurate values can never be achieved if more delay is present during multimedia signal transmission.
Fig. 4.
Fig. 4. Utilization time periods.
From Figure 4 and Table 3 it is pragmatic that amount of degree varies with two step factor between 2 to 10 with total transmission period of 1.9, 2.2, 2.3, 2.5 and 2.8, respectively. In this dissimilarity, the utilization period is calculated and compared with the existing method [6] by reproducing visualization data with degree measurements. During this comparison the proposed method outperforms the existing method in terms of utilization period in all five degrees of measurement values. It can be proved from the simulation analysis that if degree of data is 6 and time period of utilization corresponding type of data is 2.3 milliseconds then total utilization period is much less in case of projected method for about 0.07 millisecond which is highly minimized than 1 millisecond in case of existing model. Moreover, changes in values are also observed in both proposed and existing methods where utilization period changes in a random way without any accurate factor for existing cases.
Table 3.
Amount of degreeTime period of visualizationUtilization period [6]Utilization period (Proposed)
21.90.80.1
42.20.70.08
62.310.07
82.50.90.01
102.80.60.01
Table 3. Utilization Time Periods
Scenario 3. The multimedia data in the proposed system needs a greater amount of memory space to store all types of data in the system. If memory space that is allocated to multimedia data is much lesser, then it will affect the visualization period where no gain can be achieved. Further, the memory space can be measured using the bandwidth values that are supplied at appropriate amounts. If the bandwidth of transmitted multimedia signal is much higher, then more data will be transmitted and as a result large memory space is needed. Therefore, the storage space is measured as reproduction amount of gain and bandwidth that is directly separated by noise that is present in the system. If greater amount of noise is present in the system, then storage space will be occupied by noise factors as compared to multimedia data storage. Hence, this scenario examines maximization of storage space for multimedia data with minimization of noise factor in order to avoid unnecessary storage space and it is simulated in Figure 5.
Fig. 5.
Fig. 5. Maximization of storage space.
From Figure 5 and Table 4 it is realized that the following bandwidth ranges such as 2.33, 3.54, 4.89, 5.67 and 6.27 are supplied with variation in gain values that is expressed in terms of percentage. The percentage of gain that is used for simulated is considered to be same for both the existing and proposed method. In the next step a comparison is made with percentage of storage space where the proposed method outperforms the existing method with high storage space. In other terms the storage space that is provided by noise factors are much less in projected model. This can be demonstrated with supplied bandwidth of 5.67 MHz and during this range 79% of multimedia data gain is achieved. By reproducing the above-mentioned values with supplied power the proposed method increases the storage space to 90%. Whereas the existing model is able to provide only 61% of storage space, thus making the remaining space occupied by noise factors.
Table 4.
BandwidthGain (%)Percentage of noiseStorage space [6]Storage space (Proposed)
2.336745776
3.546965884
4.897476086
5.677986190
6.2782106293
Table 4. Comparison of Storage Space with Noise Factor
Scenario 4. It is always essential to build a multimedia system with stable techniques that are present with the current formation of signals. Even if different signals are combined it is necessary to separate it and stabilization can be achieved after the separation process is completed. Therefore, this scenario examines the stability of multimedia data that is represented using different forms at transmitted end. Further, the stabilization factor is measured using weight segments of four different variable parameters thus a smoothness function can be achieved in a shorter period of time. In addition, if the stability of multimedia signals is higher, then it is necessary to carry out normalization procedure with appropriate power constraint. Even in this case challenges are present but at input side it is possible to determine amount of power without any disturbance factor. Furthermore, the smoothness function is simulated and shown in Figure 6 with the addition of weight factors in the system.
Fig. 6.
Fig. 6. Smoothness function with data weights.
From Figure 6 and Table 5 it is pragmatic that the amount of data weight is varied from 5 grams to 25 grams which represents the combination of video, voice and text multimedia signals. In the proposed method, amount of data is represented as data weight in the system therefore with data weight the system conditions are checked for smoothness function and comparison analysis are made. During comparison analysis it is observed that smoothness function of the proposed method is much better than the existing method which is represented in terms of percentage. If data weight of 15 grams is considered, then the existing method provides only 78% smoothness function, whereas with same weight factor projected method processes the data at 93% in a smooth way. Even for all data weights, the proposed method using clustering technique provides better smoothness function as separation of segments are made at better formations using loop formation techniques.
Table 5.
Amount of data weightSmoothness function [6]Smoothness function (Proposed)
57385
107588
157893
207996
258198
Table 5. Sleekness Function with Data Weights
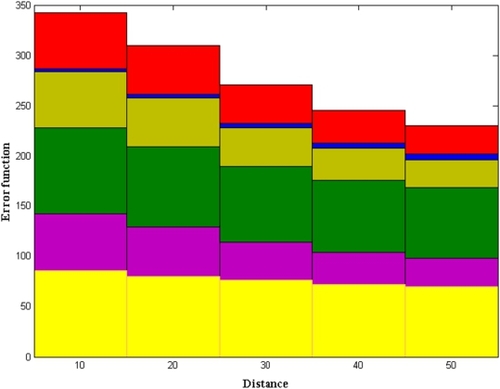
Scenario 5. There are high density points whenever the multimedia data is divided into different segments. Additionally, in the proposed method clustering mechanism is chosen, hence data paths are divided and therefore it is necessary to examine the density points in entire system. Before examining density points the approximation function of clustered segments must be chosen then if approximations are made correctly multimedia data will be formed. In case approximations are different, then points cannot be marked in multimedia data and as a result density of a particular data is increased. To reduce the density point an analytical equation is framed that provides information about marked distance in the system. The difference in distance values that are separated using error function provides minimization of density values in the proposed method. Figure 7 portrays simulation study of density values with respect to marked points in multimedia data.
Fig. 7.
Fig. 7. Density function with error representation.
From Figure 7 and Table 6 it is observed that for varying distances of 10, 20, 30, 40 and 50 meters, the error functions are measured as 2.45, 3.12, 4.62, 5.27 and 5.98, respectively. The distance is taken from neighboring multimedia systems that are providing differences between closest regions. Therefore, distance is chosen much closer with varying error rates. By using the above-mentioned specifications percentage of density is calculated and compared with existing model [6]. During this comparison case the data density of proposed method is much less and it reduces drastically below 30%. Even at the initial stage the density of data is much higher but once the distance is increased then data density is completely reduced. This can be demonstrated with a distance of 40 meters with error function of 5.27 where in this case the data density is equal to 72% for the existing method and 32 in the case of the proposed method.
Table 6.
DistanceError functionsPercentage of density [6]Percentage of density (Proposed)
102.458656
203.128049
304.627638
405.277232
505.987028
Table 6. Percentage of Density Functions

5.2 Comparison Metrics

The performance analysis of multimedia system with the presence of optimization algorithm is represented in this section where exact data transfer after clustering is monitored in terms of characteristic response. In addition, the comparison metrics will provide clear information about software convergence rate with percentage of flexibility in the system. Moreover, the multimedia system which is transferring all types of signals must respond to the receiver about robustness of a specific type that is transmitted at its end. Therefore, the performance analysis is represented using two different complexity metrics apart from robustness and convergence as follows,
Case study 1: Cosmos complexity
Case study 2: Stint complexity
Case study 1. The process of storing all data in multimedia system requires higher storage space thus complexity in space is created. Even though the topology of the system is installed with appropriate storage space, due to duplication of packets the complexity will increase. Therefore, to avoid duplication of packets and to increase the storage space both exchange and combination process must be present in the system. Thus, the proposed method uses both the aforementioned technique for measuring complexity of the system with elemental storage. The process of elemental storage will create multimedia data in table form thus ensuring low space of creation. Figure 8 describes simulation plot of cosmos complexity.
Fig. 8.
Fig. 8. Percentage of cosmos complexity.
From Figure 8 and Table 7 it is observed that best epoch periods are taken for indicating the complexity of multimedia storage systems as 20, 40, 60, 80 and 100, respectively. For each best period a separate visualization is made using simulation tool and comparison is provided. During such best epoch cases the complexity is much higher for existing method as compared to the proposed method. This can be evaluated using best epoch of 80 periods where percentage of complexity is 3 and 16 for the proposed and existing cases, respectively. The above-mentioned reduction in complexity percentage is due to appropriate clusters that is provided for each data in the multimedia systems.
Table 7.
Best epochPercentage of Complexity [6]Complexity (Proposed)
202411
40218
60195
80163
100141
Table 7. Space Complexity of Multimedia Data
Case study 2. There is a necessity that multimedia data must be transmitted within short periods as compared to standard data. The major reason for allocating short periods to multimedia data is that more rapidity is provided as compared to a standard system. Hence, this case study examines the time period of transmission for different types of multimedia data. In addition, a comparison is also made in this study where number of inputs is pre-defined in the execution process. Further, a statement code is also established in such a way for indicating the time period of transmission with elementary operation count. The time period of transmission is simulated and demonstrated in Figure 9.
Fig. 9.
Fig. 9. Comparison of time complexities.
From Figure 9 and Table 8 it is pragmatic that time complexity of the existing and proposed methods is compared, and it is determined that the proposed method takes only less time for execution as compared with the existing method [6]. This can be proved with five different best epochs of 20, 40, 60, 80 and 100 where time complexities in these cases are 2.41, 1.34, 0.8, 0.3 and 0.2, respectively. Whereas for same epoch period the existing method provides an increase in complexity as 5.04, 3.22, 2.07, 1.89 and 1.23 seconds, respectively. Hence, as a result the multimedia data is transmitted to the users within a short period of time and even these complexities are reduced for large data segments.
Table 8.
Best epochTime Complexity [6]Time Complexity (Proposed)
205.042.41
403.221.34
602.070.8
801.890.3
1001.230.2
Table 8. Time Complexities

6 Conclusions

In the proposed method various issues of visualization technique using multimedia data transfer process with clustering technique are analyzed by formulating unique analytical equations. In a common mode of establishment multimedia systems are having their own nature of transmission where the performance can only be derived in terms of analytical expressions. Additionally, clustering technique separates all types of multimedia data thus the process of transmitting the data is converted as a simple task. Whenever hierarchical clustering algorithm is introduced for multimedia visualization then it is possible to increase the security of entire network as every clustered data is visualized using distributed operation. The analytical equations represent the outcomes with five major scenarios that are compared with the existing approach that considers other algorithmic frameworks. Hence, to test the efficiency of the proposed method percentage of jitter that is present in clustered data is examined and the time period of utilization by a particular user is also determined. As more amounts of multimedia data are processed with several clusters the storage space is examined and if maximum storage space is present then sleekness verification is processed with data density points. Furthermore, the performance analysis proves that the proposed approach is less complex in terms of cosmos and time for less than 1%. In the future the proposed method can be extended by providing a high storage space of operation and complete manual modification cases can be reduced using best optimization path networked systems.

6.1 Limitations and Future Work

The major limitation of the proposed method is that every data is clustered into multiple segments, therefore if any data is lost it is very difficult to visualize it even if order of data is represented. As four independent functions are added the visualization users must depend on individual functions therefore time period of transmission is increased. Moreover, the cosmos complexity that is represented in the proposed method can be carried out as the basic model and if additional storage is needed then cost function will be maximized. Therefore, in the future the proposed work can be extended by solving the problem of data order representation and independent solutions must be taken by every user, thereby preventing the risk of high cost visualization systems.

References

[1]
Noor Bajunaid and Daniel A. Menasce. 2020. Data-driven derivation of an analytic model for parallel servers with job replication. IEEE Trans. Parallel Distrib. Syst. 31, 10 (2020), 2435–2452. DOI:
[2]
Haiyan Liu, Xiaohui Chen, Yidi Wang, Bing Zhang, Yunpeng Chen, Ying Zhao, and Fangfang Zhou. 2021. Visualization and visual analysis of vessel trajectory data: A survey. Vis. Informatics 5, 4 (2021), 1–10. DOI:
[3]
Atif Alamri. 2018. Monitoring system for patients using multimedia for smart healthcare. IEEE Access 6, (2018), 23271–23276. DOI:
[4]
Adil O. Khadidos, Abdulrhman M. Alshareef, Hariprasath Manoharan, Alaa O. Khadidos, and S. Shitharth. 2023. Application of improved support vector machine for pulmonary syndrome exposure with computer vision measures. Curr. Bioinform. 18, (2023), 1–13. DOI:
[5]
Xianwei Li, Guolong Chen, Liang Zhao, and Bo Wei. 2022. Multimedia applications processing and computation resource allocation in MEC-assisted SIoT systems with DVS. Mathematics 10, 9 (2022), 1–17. DOI:
[6]
Zhe Xu. 2021. Evaluation and analysis of animation multimedia 3D lip synchronization considering the comprehensive weighted algorithm. Adv. Multimed. (2021). DOI:
[7]
Xing Zhang. 2021. Multimedia image encryption analysis based on high-dimensional chaos algorithm. Adv. Multimed. (2021). DOI:
[8]
Lidong Zhang, B. Vinodhini, and T. Maragatham. 2021. Interactive IoT data visualization for decision making in business intelligence. Arab. J. Sci. Eng. 0123456789 (2021). DOI:
[9]
Rajalakshmi Krishnamurthi, Adarsh Kumar, Dhanalekshmi Gopinathan, Anand Nayyar, and Basit Qureshi. 2020. An overview of IoT sensor data processing, fusion, and analysis techniques. Sensors (Switzerland) 20, 21 (2020), 1–23. DOI:
[10]
Ayman Yafoz and Adil O. Khadidos. 2022. An intelligent security framework based on collaborative mutual authentication model for smart city networks. IEEE Access 10, (2022), 85289–85304. DOI:
[11]
Yanle Hu, Jing Zhou, and Bin Gao. 2021. Design and analysis of interactive multimedia online physical education platform considering moving object segmentation algorithm. Adv. Multimed. (2021). DOI:
[12]
Haibin Yu. 2021. Application analysis of new internet multimedia technology in optimizing the ideological and political education system of college students. Wirel. Commun. Mob. Comput. (2021). DOI:
[13]
Jin Du. 2022. Real-time information exchange strategy for large data volumes based on IoT. Comput. Intell. Neurosci. (2022), 1–10. DOI:
[14]
Florian Stalph and Bahareh Heravi. 2021. Exploring data visualisations: An analytical framework based on dimensional components of data artefacts in journalism. Digit. Journal. 0, 0 (2021), 1–23. DOI:
[15]
Hendrik Nolte, Thomas D. MacVicar, Frederik Tellkamp, and Marcus Krüger. 2018. Instant clue: A software suite for interactive data visualization and analysis. Sci. Rep. 8, 1 (2018), 6–13. DOI:
[16]
Yusuf Cinar, Peter Pocta, Desmond Chambers, and Hugh Melvin. 2021. Improved jitter buffer management for WebRTC. ACM Transactions on Multimedia Computing, Communications, and Applications 17, 1 (2021), 1–20. DOI:
[17]
Okwara Jerry Chizoba and Buba Abba Kyari. 2020. Ensemble classifiers for detection of advanced persistent threats. Glob. J. Eng. Technol. Adv. 5, 2 (2020), 47–56. DOI:
[18]
Wenli Liu. 2021. Research on the application of multimedia elements in visual communication art under the internet background. Mob. Inf. Syst. 2021, (2021). DOI:
[19]
Zhihan Lv, Dongliang Chen, and Haibin Lv. 2022. Smart city construction and management by digital twins and BIM big data in COVID-19 Scenario. 18, 2 (2022). DOI:
[20]
Yunchao Wang, Zihao Zhu, Lei Wang, Guodao Sun, and Ronghua Liang. 2022. Visualization and visual analysis of multimedia data in manufacturing: A survey. Vis. Informatics 6, 4 (2022), 12–21. DOI:
[21]
Youhei Kawamura, Markus Wagner, Hyongdoo Jang, Hajime Nobuhara, Takeshi Shibuya, Itaru Kitahara, Ashraf M. Dewan, and Bert Veenendaal. 2015. A multimedia data visualization based on ad hoc communication networks and its application to disaster management. ISPRS Int. J. Geo-Information 4, 4 (2015), 2004–2018. DOI:
[22]
Agnès Saulnier, Marie Luce Viaud, and Carine Lamarche. 2002. User-tailored 3D visualization of multimedia data. IETE J. Res. 48, 3–4 (2002), 281–287. DOI:

Cited By

View all

Recommendations

Comments

Information & Contributors

Information

Published In

cover image ACM Transactions on Multimedia Computing, Communications, and Applications
ACM Transactions on Multimedia Computing, Communications, and Applications  Volume 20, Issue 11
November 2024
333 pages
EISSN:1551-6865
DOI:10.1145/3613730
Issue’s Table of Contents

Publisher

Association for Computing Machinery

New York, NY, United States

Publication History

Published: 12 September 2024
Online AM: 21 July 2023
Accepted: 12 July 2023
Revised: 06 June 2023
Received: 07 March 2023
Published in TOMM Volume 20, Issue 11

Check for updates

Author Tags

  1. Multimedia
  2. visualizations
  3. clustering
  4. delay
  5. density functions
  6. security

Qualifiers

  • Research-article

Contributors

Other Metrics

Bibliometrics & Citations

Bibliometrics

Article Metrics

  • Downloads (Last 12 months)175
  • Downloads (Last 6 weeks)46
Reflects downloads up to 15 Sep 2024

Other Metrics

Citations

Cited By

View all

View Options

View options

PDF

View or Download as a PDF file.

PDF

eReader

View online with eReader.

eReader

Get Access

Login options

Full Access

Media

Figures

Other

Tables

Share

Share

Share this Publication link

Share on social media