1. Introduction
The interdependence of biodiversity loss and climate change has recently emerged as a prominent concern, highlighted by the United Nations and the Intergovernmental Panel on Climate Change [1, 2]. To meet the targets for reducing greenhouse gas (GHG) emissions, as outlined in the Paris Agreement [3], most countries are including land use changes in their nationally determined contributions. A global ambition seeks to sequester an additional 3.7 gigatons of CO2 equivalent into soils annually by 2030 compared to 2005 levels [4]. This imperative is mirrored by the UK’s commitment to nature-based solutions in its quest for net-zero emissions by 2050 [5], recently accompanied by the introduction of the Environment Land Management Scheme [6].
Species-rich grassland soils, in particular, have been recognized as important carbon stores, surpassing soils in intensively managed grasslands [7–10]. Semi-natural or species-rich grasslands also play a pivotal role in supporting pollinating insects due to their provision of diverse forage plants and habitat [11]. However, these grasslands have been gradually diminishing since the 18th century [12], primarily due to shifts in agricultural practices such as conversion to arable land, or intensification [13]. In other cases, traditional management regimes of summer mowing and winter grazing have been lost [14], resulting in overgrowth or the proliferation of invasive species [15]. By 1984, UK land area covered by semi-natural pastures had already dwindled by a staggering 97% over 50 years [16], with further losses occurring thereafter, albeit inadequately documented [17, 18]. This decline has led to substantial losses in both wildflower diversity and carbon stocks [19]. To reverse this trend, a widespread call from media outlets and non-governmental organizations has emerged, urging gardeners, landowners, and local authorities to convert grasslands and verges into biodiverse wildflower meadows (WFMs), with the aim of restoring the ecosystem services once provided by species-rich grassland [20].
During the 1980s, conservationists began to recognize the intrinsic value of hay meadows and WFM due to their rich botanical and faunal diversity [17, 19, 21], and the crucial link between biodiversity and GHG mitigation became evident [22, 23]. When land is regenerated and thoughtfully managed, biodiversity flourishes [15, 24]; the presence of seeds in the soil seed bank or in nearby hay meadows can lead to natural recolonization once mowing or conservation grazing is reinstated [25]. However, establishing WFMs can be challenging, as robust grasses often outcompete slower-growing forb species, suppressing overall plant diversity [25]. Strategies to combat this issue mainly depend on reducing soil fertility using methods such as biomass or topsoil removal [25, 26]. Dicks et al. [27] offer a comprehensive summary of strategies for generating WFM where additional seed sowing is required, including deturfing, rotavating, removing litter (scarifying), direct or slot sowing, and plug plants or spreading hay from existing species-rich meadows, together with subsequent management using grazing or mowing.
Yet, an essential question emerges: What if the process of removing soil and reducing soil fertility, advocated by many, inadvertently reduces carbon stocks and hampers carbon sequestration (CS)?
Soil carbon is initially found within soil organic matter (SOM), where it can be mineralized (released as nutrients for plant uptake or into the atmosphere as CO2) or immobilized for long-term storage, both processes driven by soil biota [28, 29]. The initial decomposition of organic matter (OM) can thus either contribute to climate change through CO2 emission or mitigate it through CS [30]. However, while it must be noted that adding OM also enhances other soil functions beyond CS [31], currently the long-term impact of OM quality on SOM decomposition and other soil properties that can impact processes delivering CS, remains poorly understood. Soil CS rates exhibit considerable variability depending on factors such as land use, management practices, climate, and soil characteristics. Measuring CS directly poses challenges, and it exhibits substantial spatial variation [32], but high CS rates are often associated with abundant earthworm populations and microbial biomass [33]. While extensive research exists on carbon storage in existing grasslands [34–37] and above-ground biodiversity [13, 27, 38, 39], including within newly created WFM [40], scarce attention has been paid to the critical question of how the transition from grassland to WFM impacts soil health or CS [41].
Given the relationship between CS and soil biota, our study explores the impact of converting grasslands into WFM on soil life or activity of microbes and detritivores [42, 43] in the upper soil layers during the initial months following transformation. Our study’s null hypothesis (H0) states that converting grassland into WFM, using the conversion strategy of biomass removal (scarifying) or the strategy of topsoil removal (deturfing), over one growing season does not significantly alter a decomposer population (earthworms) in the soil [44–47], and does not alter an indicator of the decomposition process, namely microbial activity as measured by respiration of cotton cellulose in the cotton strip assay (CSA) [48]. This study, focusing solely on the initial spring and summer periods, aims to provide insights into the short-term effects of WFM conversion on soil dynamics and CS potential.
The findings are discussed with reference to three possible theories: that an intermediate level of soil disturbance [49] might positively impact the diversity and abundance of soil biota (Section 4.3); that greater plant diversity could result in more diverse root lengths and exudates [50] leading to an increase in microbial activity (Section 4.4); or that the addition of fresh decaying OM (cut grass) might lead to an increase in bacteria relative to fungi, as described in the theory of soil proposed by Neal et al. [51] (Section 4.5), and this may increase microbial activity and earthworm populations.
2. Materials and methods
The experiment was conducted in 2021 in an abandoned pasture located in the Surrey Hills AONB between March and August, the best time for seed growth and OM decomposition [52]. The Ordnance Survey coordinates of the site are TQ 1065 4249, with elevation above sea level 142.6 ± 1.4 m, and a slight Southerly aspect. The site for the experiment was level and not shaded by trees; the soil assessed as a reddish-brown sandy loam with pH 6.4–6.8 covered by ~5 cm darker topsoil, consistent with the Soilscapes [53] description of “a freely draining, moderately acid but base-rich loamy soil” at this location.
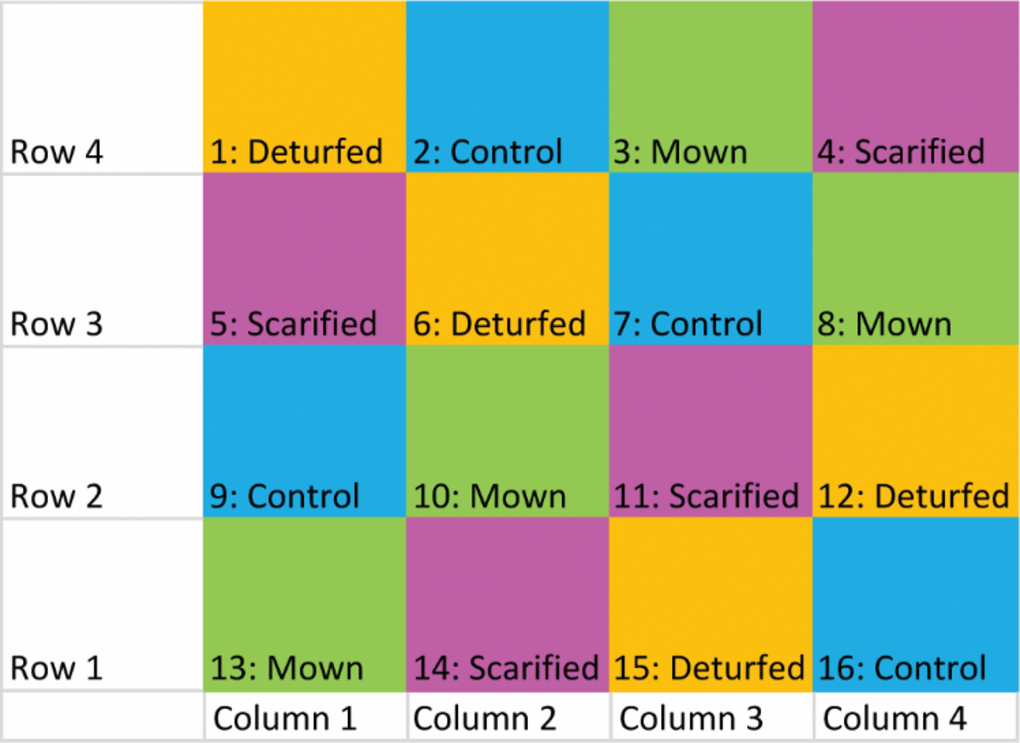
The study employed an in situ block plot design with four replicate blocks, each containing distinct grass/meadow treatment options, resulting in a total of 16 experimental plots (Figure 1). This approach, based on Sutherland [54] and Wheater [55], offered a controlled yet realistic setting. The randomized blocking technique ensured that treatments and samples were independent and met conditions for parametric analysis.
Figure 1
The Latin square design used for the WFM plots. Each plot, row, and column are numbered as shown so that any trends across the block could be taken into account in the analysis.
Two distinct strategies for converting grassland to WFM were evaluated, involving different levels of soil disturbance and based on widely accepted guidelines [56, 57], namely scarification and deturfing; the two non-WFM treatments for comparison were mowing and a control.
A homogenous surface of 8 × 8 m2 was divided into 16 plots of 2 × 2 m2 each (Figure 2): four served as Controls; in the four Mown plots, the grass was cut three times in the six months of the experiment and left in place; in the four Scarified plots, above-ground biomass was removed from 50–70% of the square; and in the four Deturfed plots, the entire vegetal cover was removed including roots and topsoil to a depth of 5–10 cm to leave bare soil. The treatments are summarized in Box 1.
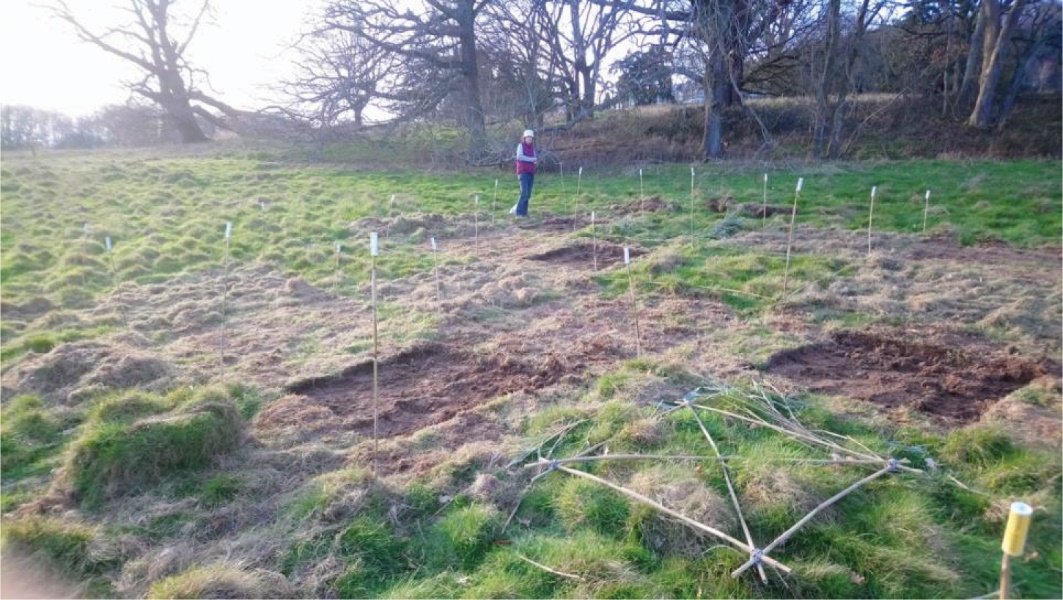
Figure 2
The 16 plots on 9 March 2021, corners marked with bamboo canes, after mowing, scarifying and deturfing, but before sowing seeds. The nearest (with quadrat resting on it) is plot 16 (see Figure 1).
Box 1
The four treatment or management strategies. Four replicates for each treatment makes 16 plots in all. Strategies 1 and 2 are two forms of existing management, Strategies 3 and 4 are the wildflower meadow (WFM) conversion strategies.
Control: leave alone.
Mown: mow infrequently, approximately every two months, leaving the arisings on the surface.
Scarified: mow and remove arisings and enough existing plant biomass to leave 50–70% of the earth bare. Sow with wildflower seeds typical of species-rich grassland.
Deturfed: mow and remove the turf and topsoil to 5–10 cm. Sow with wildflower seeds typical of species-rich grassland (as in treatment 3).
Earthworms collected by hand were sampled in five rectangular cuboids of soil measuring ~15 × 20 × 15 cm arranged in the central square meter of each 2 × 2 m2 plot of the experiment, to avoid border effects (Figure 3).
Cotton strips measuring 15 × 25 cm were placed vertically in the soil (five in each central square meter; Figure 3), to estimate the speed of degradation of these in the control and in the three different treatments of the experiment.
The initial earthworm sampling measurements were collected prior to the WFM conversions, on March 8, 2021, referred to as day 0. These measurements served as the baseline for statistical analysis of earthworm data and were all categorized as Control since they were taken before conversion. For the CSA baseline, organic Calico sheet was cut into five sets of 16 strips measuring 15 × 25 cm. Each strip was individually weighed, with a mean mass of 5.89 ± 0.18 g. It was noted that the strips were susceptible to fraying, so precautions were taken during handling to prevent fraying.
Figure 3
The 2 × 2 m square layout for each of the 16 plots showing position of the sampling pits (initially 15 × 15 × 15 cm, later 20 × 20 × 15 cm) and CSA cotton strips within the central 1 × 1 m, to avoid edge effects. At each sampling session, a different spot was chosen within the 1 × 1 m central area, away from the previous dig to minimize any effects of disturbance; the same position was used relatively for each plot, following Wood et al. [58], with the position identified using a 1 × 1 m quadrat. The brown squares show the location of the five sampling pits, labeled to indicate the order. The orange lines (a–e) show where the CSAs were inserted.

With the exception of the Control plots, after the initial measurements, all other plots were prepared according to the three treatments (Box 1). Wildflower seeds were sown on the Scarified and Deturfed plots following the recommendations of Jarvis [56] and Fry et al. [59]. Two seed mixes were sourced from Emorsgate Seeds (Wisbech, Cambridgeshire, UK), specializing in British native wildflower seeds. The selected mixtures included a meadow mixture (EM4F) and a cornfield annual mixture (EC1) to support the establishment of the meadow mix. Recommended seeding rates were 1.5 g m−² for EM4F and 2 g m−² for EC1.
Standard hand-sampling procedures, as outlined by Robertson et al. [60], were followed for earthworm sampling. The spit of soil was removed onto a tray for sorting by hand, with the earthworms collected in a container, counted and weighed using scales sensitive to 0.01 g. Both earthworm biomass and abundance were recorded to ensure data robustness. Sampling focused on the upper 15 cm of soil, consistent with the depth utilized by the UK Countryside Survey [5, 61], appropriate for assessing earthworms [46, 62, 63]. Pit dimensions were meticulously recorded to be used as weighting factors in the statistical analysis.
For the CSA, the 15 × 25 cm strips were inserted into each plot lengthways with 5 cm of the strip wrapped around the bottom of the spade as it was pushed into the slot, leaving 5 cm above the ground. Short bamboo canes marked the positions (Figure 4). The strips were later retrieved, cleaned, dried, and weighed. All samples were dried and weighed in the same atmospheric conditions as for the baseline measurement. This method is widely used as a practical means of comparing land management practices [64–66].
Figure 4
Measuring out and inserting CSA cotton strips and marking with short bamboo poles for later retrieval. Left: into a Scarified plot. Right: into a Deturfed plot. 12 March 2021.

The two wildflower seed mixes were mixed with a ratio of 1:0.63 WFM mix to cornflower annual mix, prior to one-week stratification before sowing. One portion (20.75 g) of seeds were scattered evenly on each of the Deturfed and Scarified plots and gently trodden in, without additional watering, as the ground was sufficiently moist. Seed germination began in the following two weeks. However, there followed a seven-week period with very low rainfall and higher-than-average temperatures, causing a lack of progress in seedling growth. To address this, all plots were watered on days 34 and 50 with at least 10 mm water.
2.1. Further measurements
After constructing the WFMs, measurements were taken on various dates as indicated in Table S1, Supplementary materials, which outlines the main activities with corresponding dates and day numbers (calculated from day 0). Measurements were also made of seed germination, estimated height and coverage by grass and forbs, and weekly measurements of rainfall and max/min temperature, which are all factors that may influence the soil biota.
When retrieving the cotton strips (CSAs), the soil was loosened using a spade, and the strips were gently pulled out using the 5 cm protruding from the soil surface. In some cases, the strips were too decomposed to pull, so in such instances, the soil was excavated and examined to retrieve all the fibers, including any frayed pieces. Each retrieved strip was placed in a separate labeled plastic bag.
The strips removed from the plastic bags were laid out to dry quickly under glass to prevent further deterioration. After drying, soil and plant matter were meticulously removed from the strips, with particular attention to any fraying or loose cotton thread. The strips were individually placed into a sieve and washed by hand in soapy water using gentle agitation to remove any remaining soil, followed by another drying step. Finally, no longer than two weeks after retrieval and within the recommended four-week maximum period [67], the strips were re-weighed to assess the extent of material loss through decomposition.
Because it had been so dry in April and the wildflower seeds had scarcely germinated, the lifting of the ‘b’ strips was delayed to give more time to decay from day 55 to day 83. However, by day 83, some appeared already so disintegrated; therefore, a decision was made to extract the ‘c’ strips at the same time and combine the measurements. Strips ‘d’ and ‘e’ were inserted at this time in a new position to cover the following weeks of the experiment.
2.2. Data analysis
Statistical data analysis was carried out using Excel v16.54 and SPSS v27 [68]. A two-way between-groups ANOVA with treatment and time as the two independent variables was used to test the effect of treatment and time on the earthworm abundance and biomass data, and ANCOVA was used to adjust for the confounding factor of plot position.
The Pearson product-moment correlation was used to investigate the relationship between earthworm mass and abundance, calculating the correlation coefficients and associated p-values.
For the CSA, the data were modeled using linear and exponential curves and fitted using standard multiple regression, with time and treatment as independent variables and the strip mass remaining after time as the dependent variable, after checking that the assumption of normality was not invalidated.
Given the variability in pit sizes, earthworm abundance and biomass data were weighted by the area of the pit, following the approach by Robertson et al. [60]. A few pits (5 out of 80 samples) having a large population of ants, potentially influencing detritivore populations and decomposition [69], were identified as low-abundance outliers and were excluded from the calculations.
For CSA data, the initial masses of the second set of strips (‘d’ and ‘e’) were normalized to the final percentage remaining of the first set to create a continuous dataset.
Before conducting correlation analysis or ANOVA, the data distributions and skewness for earthworm and CSA data were assessed using the Kolmogorov-Smirnov tests, Levene’s test of equality of error variances, and visual examination of histograms, Q–Q plots, and box plots. As abundance and biomass data did not follow a normal distribution, square-root transformations (abundance data) and lognormal transformations (base 10; biomass data) were applied before conducting ANOVA tests.
Following data transformation to achieve normality and homogeneity of variances, Tukey’s adjusted differences of least square means were used to compare treatments. In statistical tests, a p-value of 0.05 or less was considered significant. Reported errors are ±1 standard error (SE), unless otherwise indicated.
3. Results
3.1. Overall earthworm abundance and biomass trends
To understand the effects of WFM conversion, earthworm abundance and biomass were measured to a depth of 15 cm, on five occasions spread over the six months of the project. The baseline count (week 0) revealed a mean of 548 ± 84 earthworms per square meter across the 16 plots, ranging from 110 to 905 m–2. After conversion (week 4), earthworm counts dropped to a mean of 389 ± 36 m–2 (a 29% decrease). The decline continued, hitting 272 ± 54 m–2 at week 8 (a 48% drop) before gradually recovering to 540 ± 112 m–2 at the final count. Earthworm biomass began at 75.8 ± 20.3 g m–2, stayed steady (within errors) until at least week 8, and then increased at each count, peaking at 137.3 ± 28.5 g m–2 after 24 weeks.
A robust correlation between per-plot earthworm biomass and abundance was evident. The Pearson product-moment correlation coefficient indicated a strong, significant correlation (r = 0.618, p < 0.001), suggesting that the average individual earthworm mass remained relatively consistent throughout the project.
Impact of weather and vegetation cover
The amount of grass and forbs in each plot was unsurprisingly affected by conversion to WFM. Grass height and coverage dropped immediately due to conversion, while forbs coverage gradually increased, driven by wildflower seed germination and existing forb growth as summer approached. Although some seeds germinated within two weeks, growth of the wildflowers was delayed by unseasonably low night-time temperatures and low rainfall (only 19% of expected) in the first eight weeks (Table S2, Supplementary materials), with the UK Met Office recording fewer than five days with >1 mm rain in March or April [70].
By week 24, the Deturfed plots were 90–100% covered by forbs, almost entirely consisting of the sown wildflowers, the Scarified plots had ~50% forbs, while non-WFM had less than 25% (Table S3, Supplementary materials). Clearly, the bare and disturbed ground was better for seed germination, but percentage forbs coverage was found to be negatively correlated with earthworm abundance (r = –0.421, p = 0.02). In contrast, there was a positive correlation between the number of earthworms and the grass coverage, with percentage grass coverage positively linked to both earthworm abundance (r = 0.568, p ≤ 0.001) and biomass (r = 0.311, p = 0.007).
3.2. The effect of treatment on earthworm abundance/biomass
Table 1 summarizes earthworm abundance measurements by treatment. Post-conversion, the abundance dropped in all treatments, but for the Control and Mown plots, the drop was not statistically significant (p > 0.05). By four weeks, the WFM abundances combined fell to 45% compared with the baseline, with Deturfed plots alone showing the largest reduction (to 31% at four weeks).
Table 1
Mean earthworm abundances for each treatment, starting with baseline measurements before the wildflower meadow (WFM) conversions had taken place, and then 4 and 24 weeks after conversion. Each abundance count is weighted by pit area and converted into abundance per m2. Column 4 gives the percentage abundance at four weeks divided by the baseline abundance to give a relative measure; column 6 gives the percentage abundance at 24 weeks relative to the baseline. Row 4 (in bold) gives the combined abundance of the two non-WFM treatments (Control and Mown) averaged, while row 7 (in bold) gives the combined WFM treatments averaged. Bottom row: average earthworm abundance for all the 16 plots. Errors are ±1 SD and have been propagated for the combined abundances. See also Figure 5
Using all the data, with the initial measurements classified as control, a one-way between-groups ANOVA on the abundance data revealed significant treatment differences (p < 0.05), with Deturfed having significantly lower earthworm abundance compared to the other treatments (p < 0.001). Mown, Control, and Scarified earthworm abundances did not significantly differ from each other. Earthworm biomass exhibited similar patterns, with Deturfed treatments having significantly lower earthworm biomass than all other treatments (p < 0.001), while in the Scarified plots, earthworm biomass was not significantly lower than either non-WFM treatment. The Mown plots had significantly higher earthworm biomass than Control (p < 0.001).
3.3. The effect of both time and treatment on earthworm abundance and biomass
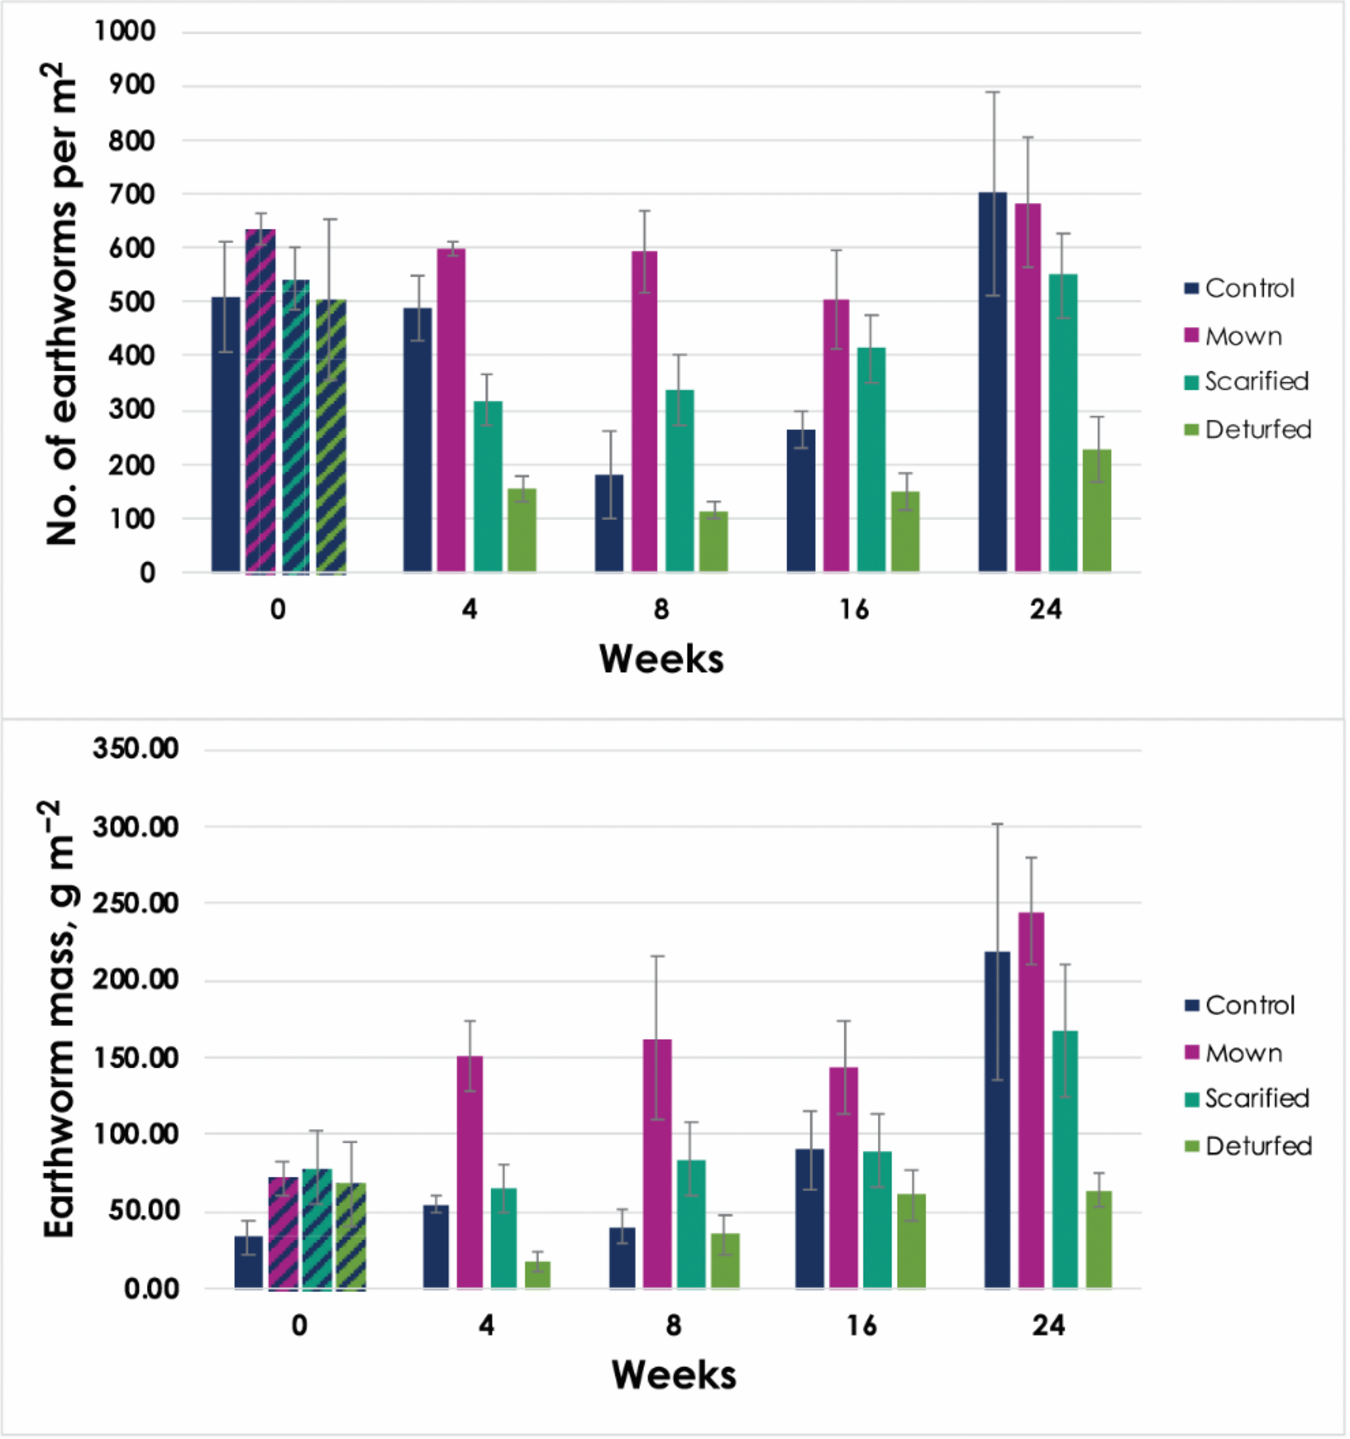
Figure 5 displays earthworm abundance and biomass grouped by treatment and date of sampling. Control measurements ended higher than for the other treatments, while the Mown plots had more consistently high abundance levels. The Scarified and Deturfed plots showed abundance declines post-conversion, with Scarified eventually recovering to baseline levels, but Deturfed remained low.
Figure 5
Earthworm abundance (top) and live biomass (bottom) divided by treatment, recorded at each of the five counts. The four different treatments are Control (dark blue), Mown (pink), Scarified (turquoise), and Deturfed (green). The first bars are shaded to show that this count (at week 0) was recorded before the WFM conversions had taken place, and the measurements are therefore ‘baseline’ or ‘control’. Note that the x-axis is not proportional; the tick marks correspond to each count. Error bars ±1 SE.
Two-way between-groups ANOVA with treatment and time as the two independent variables were performed to test the effect of treatment and time on the abundance and biomass data. In both cases, the interaction between treatment and time was not significant (F = 1.01, p = 0.442 and F = 0.916, p = 0.518, respectively).
For earthworm abundance, there were statistically significant main effects for both time and treatment when tested separately (F = 5.218, p < 0.001 and F = 20.432, p < 0.001, respectively) with partial eta squared = 0.265 and 0.514, respectively, suggesting that 51% of the difference in variance was due to treatment. Post-hoc comparisons using the Tukey HSD test indicated that the mean score for Deturfed (M = 12.30, SD = 3.25) was significantly lower than all other treatments (p < 0.001), Mown (M = 24.12, SD = 3.90) was significantly higher than Scarified (M = 19.84, SD = 3.95), while Control (M = 21.34, SD = 6.03) did not differ significantly from either Mown or Scarified.
For earthworm biomass, there were also statistically significant main effects for both time and treatment when tested separately (F = 3.865, p = 0.008 and F = 14.429, p < 0.001, respectively) with partial eta squared = 0.21 and 0.427, respectively, suggesting that 43% of the differences were due to treatment. Post-hoc comparisons using the Tukey HSD test indicated that the mean score for Deturfed (M = 1.48, SD = 0.36) was significantly lower than all other treatments (p < 0.001), Mown (M = 2.15, SD = 0.22) was significantly higher than Control (M = 1.79, SD=0.32), while Scarified (M = 1.90, SD = 0.30) did not differ significantly from either Mown or Control.
Consideration of plot position
To account for potential plot position effects, correlations between plot position variables (Figure 1) and earthworm abundance and biomass were assessed. A small but significant correlation emerged between row and earthworm biomass (r = –0.276, N = 75, p = 0.017), suggesting that row number influenced results by 17%.
A two-way ANCOVA adjusted for row number increased the significance of the relationships among earthworm biomass, time, and treatment (partial eta squared increased from 0.21 to 0.25 for time and from 0.427 to 0.472 for treatment), indicating that 47% of the effect was due to treatment once row number was accounted for.
3.4. CSA trends
The CSA showed decay across all treatments (Table 2), and while an exponential decay and linear decay model both provide good fits, the linear model slightly outperforms the exponential model (Figure 6).
Table 2
Decomposition rates per day and per year using a linear fit to the CSA decay, grouped by treatment. m is the gradient of the decay in percentage lost per day. Errors are ±1 SE; n = 20. See also Figure 6
Figure 6
CSA measurements of the mean percentage mass of the cotton strips remaining after the time buried in the soil (x-axis) separated by treatment, fitted with a linear model, the parameters given in Table 2.
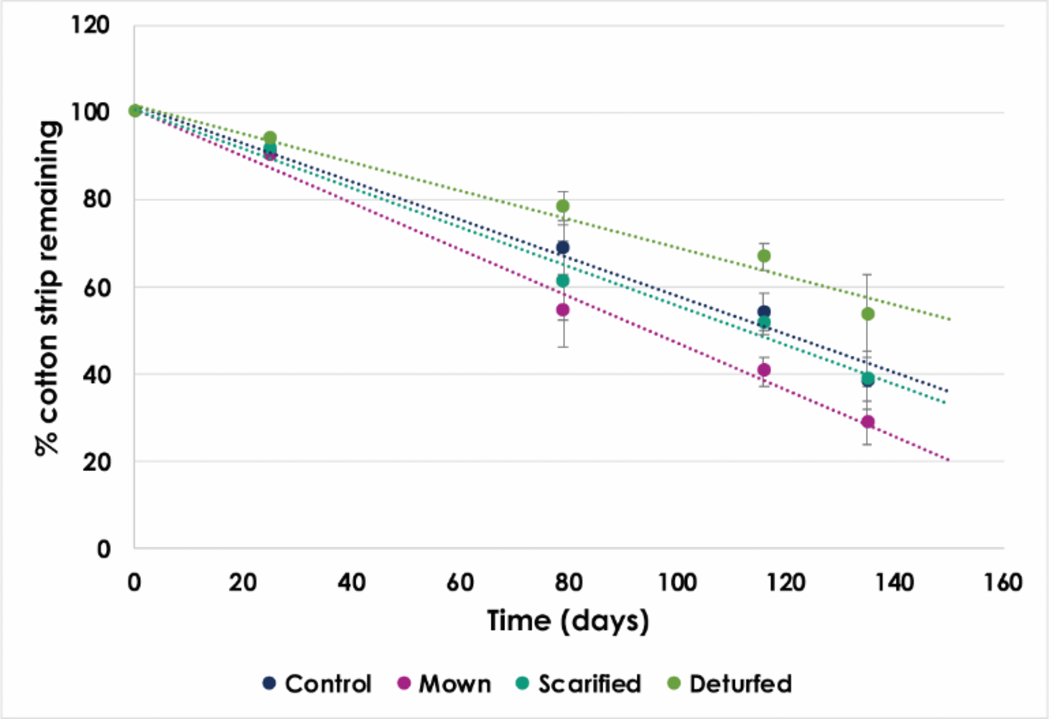
CSA decay depended on treatment. Time was the dominant factor in the measurement of the percentage strip mass remaining (87%), while treatment contributed 13% (p < 0.001, p = 0.016). The Mown plot CSAs exhibited the highest decay rates, while the Deturfed plots had the lowest. The Control and Scarified CSAs showed similar rates.
4. Discussion
The results indicate that converting grassland to WFM can indeed have a significant effect on both earthworm and microbial populations, contrary to the null hypothesis that converting grassland into WFM using either of two strategies does not change the decomposer population in soil over one growing season (H0; Section 1). The differing impacts of mowing, scarifying, or deturfing highlight the importance of WFM conversion strategy on soil life and potentially on CS.
4.1. Effect of WFM conversion method
Grassland in the UK typically sustains 100–500 earthworms m−2 [62]. In this study, we measured a healthy baseline earthworm abundance of 548 ± 84 m–2, with live biomass measurements between 75 and 138 g m–2, higher than the 30–100 g m–2 normal range suggested by Lavelle et al. [71], suggestive of an active, fertile soil. The sampling did not distinguish between types of earthworms and comprised epigeic, endogeic, and anecic earthworms. Averaging over all plots, earthworm abundance significantly declined by 29% immediately upon WFM conversion, later dropping by an additional 20% before gradually recovering to 99% of the baseline by 24 weeks. This initial decline suggests that the earthworms were negatively affected by disturbance, mirroring findings by George et al. [72].
All cotton strips decomposed steadily when buried with a mean decay of 0.44 ± 0.08% per day, taking 192–278 days for complete decomposition, consistent with other studies on cotton strip mass loss [73]. Generally, microbial decay, rather than chemical breakdown, leads to CSA disintegration [67].
Earthworm abundance and biomass exhibit seasonal variation [54, 74], increasing from early spring to late summer. The rebound after week 8 may be a seasonal effect, while the earlier drop between weeks 2 and 8 coincided with low rainfall, impacting earthworms which are sensitive to drought [75]. Interestingly, the earthworms in the Mown plots fared better, possibly due to surface mulching by arisings, mitigating loss of moisture. These specific outcomes may be soil-type- and weather-dependent, but the thick thatch providing mulch for the Control plots makes it unlikely to be the sole explanation.
Comparing treatments reinforces evidence against H0. The earthworm abundance after conversion fell by 55% when only the WFM treatments are considered, while the abundance was maintained in the non-WFM treatments. Similarly, CSA decay rates varied among treatments, with the Mown CSAs showing the fastest decay (0.54 ± 0.043% per day) and Deturfed CSAs the slowest (0.323 ± 0.047% per day). This suggests reduced microbial activity in the Deturfed plots and heightened activity in the Mown plots.
Because of the removal of the organic layer in both the Scarified and Deturfed plots, and in addition 5–10 cm soil in the Deturfed plots, the earthworms were effectively sampled from greater depth in the soil in these treatments, where the earthworm density was generally found to be lower. This adds weight to the finding that the earthworms were more numerous in the Control and Mown cases. Likewise, the CSA strips were inserted at a greater depth relative to the soil horizon in the Scarified and Deturfed plots, and were missing the organic layer where more biodegradation would be expected.
Mown treatment yielded the highest earthworm populations throughout, significantly surpassing other treatments, unlike in the experiment conducted by Hyvönen et al. [76] who found fewer earthworms in their Mown treatments compared with WFM over a long-term (15-year) experiment on annual autumn mowing, but their experiment may have been affected by allelopathy from Centaurea jacea [76].
The Deturfed plots displayed the lowest earthworm counts, even after wildflower growth. Rainfall after week 8 failed to attract earthworms back into the Deturfed plots. The Scarified treatment produced similar earthworm populations and CSA decay rates to the Control, suggesting that the initial surface disturbance and removal of thatch had little effect on the soil community, and the addition of the wildflowers made little difference. In some Control plots, earthworm counts were very low; just a single earthworm (equivalent to 21 m–2) was retrieved from one plot at the eight-week count, attributed to an ants’ nest found at this position. Alternatively, it could be that the thick root mat discouraged earthworm foraging [76], but this would also be true of the Mown plots that never yielded fewer than 10 earthworms (217 m–2) in a single plot count.
4.2. Consistency of findings between earthworms and CSA
While no statistical correlation can be sought between the continuous CSA decay measurement and discrete earthworm samples, both metrics reflected treatment effects. The measurements indicate that the soil community was more active in the Mown plots and was reduced in the Deturfed plots, while conversion by scarifying maintained levels similar to those found in the undisturbed Controls. Many microorganisms in soil remain dormant until stimulated into activity, perhaps by earthworms [77, 78] or by other factors that also affect earthworms such as moisture, and the fact that the earthworm results and CSA tracked each other suggests that these may be influenced by the same factors, unlike the results described by Hansen et al. [79] and George et al. [72] where the earthworms and microbes responded differently: in these studies, earthworms were most (negatively) affected by disturbance, while microbes responded to soil properties and nutrient availability. However, the Hansen et al. [79] experiment compared the effect on earthworms and microbial soil life of straw being either incorporated or removed and turned into biochar before returning to the soil. Therefore, the OM being applied and the method of incorporation (using disc harrow) were different from the current work; in particular, the plots with most OM added were also the most disturbed. George et al. [72] conducted a meta-study addressing the impact of agricultural intensification on diverse ecosystems, finding that soil fauna was generally impacted by the land management, while microbial communities responded to the nutrient availability. In terms of the microbial soil life, this is consistent with the current work where the highest level of nutrient availability corresponded to the fastest CSA decay, but their study showed maximum numbers of earthworms in their undisturbed control plots, which is different from this work.
4.3. Disturbance or intermediate disturbance
Conversion of grassland to cultivated crops is known to affect CS [34, 80, 81]. The disturbance caused by the deturfing could be seen as akin to cultivation, expected to reduce CS, demonstrated by reduced earthworms and CSA decay rate. However, the breaking of soil aggregates during deturfing could have increased microbial access to OM and therefore decomposition [50, 82], but this was not seen, perhaps because the turfs were removed without any digging of the soil underneath the turfs. Vegetation removal could lead to reduced earthworms [78] and lower microbial activity due to more extreme temperatures and drier soil [83]. Reduced earthworm populations and CSA decay in the Deturfed and Scarified plots followed by slow recovery align with these findings. Wang et al. [84] found that microbial communities respond to “site preparation”, whereby clearing brush reduces bacteria and fungi due to loss of roots and litter, but where decaying plant matter is left, the opposite is seen, aligning with the findings from the Mown plots.
Grassland will eventually revert to woodland without management [13, 85] through succession, generally leading to increased carbon storage in biomass above and below ground [86]. However, a low or intermediate level of disturbance [49], like mowing or grazing, is known to support high species diversity [87, 88], but impacts on soil biota remain unclear due to niche differentiation [89]. Consistent with the Intermediate Disturbance Hypothesis, in this study the Mown plots with a low-level disturbance were seen to have increased soil activity compared to Control.
4.4. Plant diversity and root exudates
Species-rich grasslands hold more carbon than intensively managed grasslands [61, 90], which suggests high species diversity may be the cause. Alternatively, it could be because species-rich grasslands are not disturbed. In a wide-ranging literature review, Moxley et al. [91] found that deep roots relating to a diverse sward can increase CS, but they admit that there is a knowledge gap around the disturbance of re-seeding grassland. Dicks et al. [27] summarizing 28 studies on restoring species-rich grassland found that earthworm abundance increased compared with the control, either because of lack of disturbance or increased diversity.
Many wildflowers are well-adapted, resilient species producing biomass even when conditions are not ideal [81]. In the WFM plots, diverse plants with differing root depths and exudates are expected to increase soil microbial activity [10, 92–94]; they enhanced microbial activity and dense ground cover (preventing loss of soil moisture), thereby enhancing SOC and resilience to climate change [10, 92]. However, our CSA results did not confirm this; in the short term, disturbance appeared to be the dominant factor rather than the higher plant diversity found in the WFM plots compared with the non-WFM plots.
Similarly, earthworm abundance has been found to be related to net primary production (NPP) or root depth [30, 95]. Species-rich grassland has higher root-derived organic carbon inputs and longer mean soil residence time than arable crops [96]. The longer residence time of root-derived than shoot-derived carbon (~2.4 times) is thought to be due to the effect of mycorrhiza fungi and chemical interactions at depth [97]. We found that earthworm numbers correlated with grass coverage and therefore NPP, but negatively with forbs (Section 3.1), possibly due to intrinsic grass preference, lower disturbance in grassy plots, or less favorable soil conditions in WFMs. Wildflowers did not have a positive impact on earthworms, but this could change with longer timescales.
Mowing stimulates grass growth, enhancing NPP, which can itself lead to an increase in SOC [98, 99]. Leftover arisings can also maintain SOC [98], a finding that is supported by increased earthworms in the Mown plots. Root pruning from mowing can lead to dead roots providing material for decomposition [100], benefiting life in the soil, while forbs may not respond well to mowing.
Scarifying was seen to maintain soil communities at similar levels to Control, while mowing promoted the highest soil biota abundance, unaffected by wildflowers’ presence or absence. The Deturfed plots displayed abundant wildflowers (Table S3, Supplementary materials) but may require ongoing intervention for perennial wildflower maintenance to prevent the plots from returning to grass dominance.
4.5. The theory of soil
The soil food web collaborates to maintain the optimal conditions for soil life, akin to the Gaia theory proposed by Lovelock [101] and expanded upon by Lenton and Latour [102]. Neal et al. [51] further developed a “theory of soil” that establishes crucial connections between the physical structure and biological functions in the soil which are influenced by soil management decisions. These associations support the theory that the soil biota self-organizes and influences soil structure with the quality of organic carbon inputs exerting an influence on the nature of this association. If the resulting SOM possesses a high carbon to nitrogen ratio, microbes are prompted to manage excess carbon by excreting it in extracellular polymeric substances to create soil aggregates [103], a structure in which microbes thrive. With the addition of extra nitrogen, microbes metabolize the excess carbon, releasing CO2 [51]. This results in the loss of carbon, causing pores to shrink and diminishing the soil’s ability to support microbial life [51].
The Control plots featured a thick (~5 cm) thatch of dry, nitrogen-poor OM, combined with roots, forbs, and grass. Overcrowding would have led to reduced light and warmth, hindering strong grass growth [41]. The slow decomposition of thatch, containing high lignin content, is typically associated with fungal dominance [104–106], and in this situation, CO2 emissions from respiration tend to be low [51]. The slow processing of the thatch and grass roots would lead to gradual CS.
In contrast, the Mown treatment introduced OM from grass clippings which are typically nitrogen-rich [76], favoring bacterial decomposition over fungal [42], leading to increased CO2 emissions and lower CS [107]. However, an increase in earthworms was also observed, suggesting that while there may have been an initial increase in mineralization, eventually it would lead to increased CS [108] with an associated increase in SOM, itself vital for other soil functions [31].
Both WFM treatments (Deturfed and Scarified) led to reduced thatch and plant biomass for decomposition. This may have altered the bacteria-to-fungi ratio. The Scarified plots lost slowly decaying, carbon-rich material but also experienced initial disruption, decreasing decomposition subsystems. The Deturfed plots, with the most soil disturbance and no fresh nitrogenous matter added, also showed reduced decomposition. No evidence of fungal colonization increasing CSA mass, as suggested by Latter et al. [48], was found.
Soil carbon in grassland is expected to reach an equilibrium related to nutrient availability [94, 109, 110]. The Control plots’ medium activity may be due to equilibrium as the land had been grazed intermittently for ~50 years. On the other hand, high fertilizer input can lead to low CS [82]. There may be a management sweet spot enhancing carbon by increasing primary productivity, possibly through species diversity, without overstimulating decomposition [10]. The Mown plots may have benefited from modest fertilization without excessive decomposition. In WFM, deeper roots, legumes, and some disturbance may increase fertility in the future, eventually surpassing Control’s earthworm and microbial activity.
Indicators like earthworms or CSA are practical for assessing soil health but can oversimplify complex soil processes, drawing criticism from some authors [111]. Analyzing soil samples for carbon content or measuring greenhouse gas emissions would reveal whether CSA decay is linked more to CS or mineralization. Separating bacterial and fungal activities, increasingly investigated through genetic sequencing, can offer a clearer understanding of the processes involved (e.g., [51]).
5. Conclusions
The need for land management practices associated with halting biodiversity loss and climate change has led to wide interest in converting grassland to WFMs. It has been claimed that WFM tend to sequester soil carbon at a higher rate than other grassland. However, while many have researched the effect on biodiversity associated WFM, the effect on CS and the soil biota has been less well studied, particularly with respect to strategies for making WFM. Until this aspect is better understood, land workers and managers cannot aim to optimize both biodiversity and CS.
Results revealed that WFM conversions significantly affected earthworm populations and CSA decay rates. Earthworm abundance dropped by 55% in the WFM plots, with the Deturfed plots being the most affected. In contrast, the Control and Mown plots maintained their earthworm populations. The CSA decay rate was fastest in the Mown plots and slowest in the Deturfed plots.
Overall, the Mown plots maintained a healthier soil decomposer population most likely due to lower disturbance and provision of resources by leaving arisings. In the Deturfed plots, the earthworm population suffered from resource removal and disturbance, and the addition of wildflowers did not compensate.
The experiment highlighted that initial earthworm abundance/biomass and CSA decomposition changes were primarily influenced by disturbance rather than the higher plant diversity provided by the growth of wildflowers in the WFM plots. Infrequent mowing leaving arisings outperformed the WFM plots in terms of soil activity but produced fewer wildflowers. Although CS wasn’t directly measured, the plots with higher earthworm populations and a more active microbial community could potentially have a higher level of CS. The soil community in the Deturfed plots did not recover during the six months of the experiment.
In conclusion, converting grassland to WFM may enhance above-ground biodiversity, but removing topsoil to reduce fertility should be reconsidered. Scarifying, which maintains soil life and provides space for wildflower germination, can be a successful WFM strategy without turf removal. Infrequent mowing leaving arisings keeps the soil community active but doesn’t promote wildflowers. These findings may vary in different conditions.
Given the limited existing knowledge on the impact of WFM on CS, further research is essential, considering various parameters like timing, frequency, soil types, climate, and land use histories. It is crucial to explore best practices for meadow-making as a strategy to enhance biodiversity, CS, and soil-based ecosystem services. If these findings are validated in broader experiments, they should influence guidelines for nature-based solutions to address climate change and biodiversity challenges.