Breaking down monthly trends across digital channels by industry category
This analysis builds on the Monthly Paid Media Snapshot to look at changes in spending and ad prices by industry category. As with any benchmark, your results may vary, but we hope this provides more context for you as a marketer as you navigate the ups and downs of your program’s performance.
Methodology: Only Skai accounts with spend above a minimum threshold for the previous three months are included in these benchmarks. Where applicable, categories are assigned through a combination of algorithmic and manual methods, both at the account level and the Skai profile level. Please note that the selection criteria used here differ from the Skai Quarterly Trends Report and subsequently may not be consistent with those results in all cases. Starting in November 2023, paid social data has been expanded to include Meta, Pinterest, TikTok, LinkedIn, and YouTube.
How to read these charts
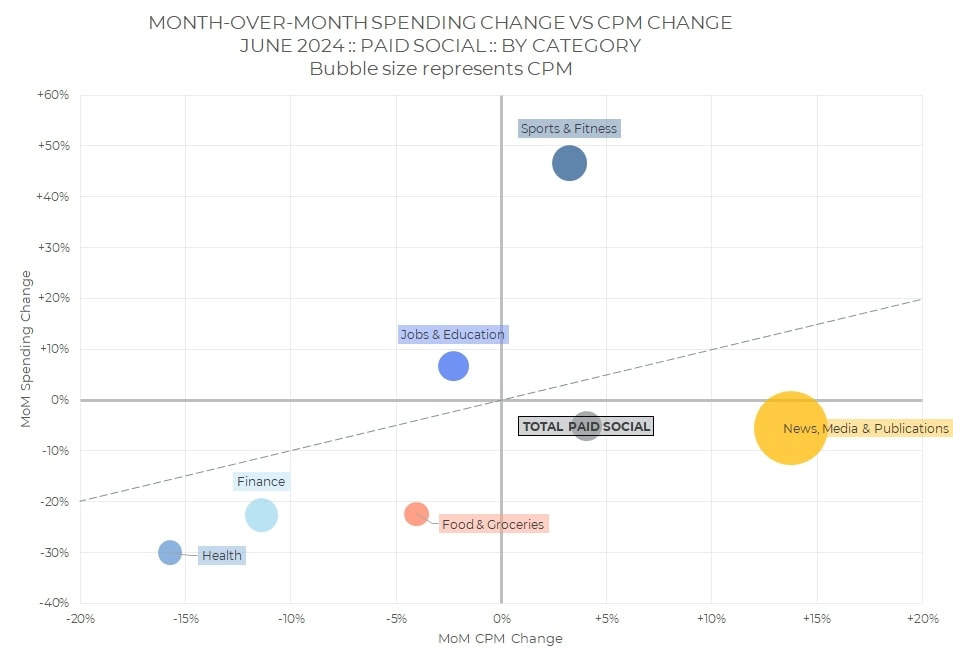
The x-axis represents month-over-month (MoM) changes in ad pricing–average cost per click (CPC) for paid search and retail media and average cost per thousand impressions (CPM) for paid social. The y-axis represents MoM changes in total ad spending for the category. The size of the bubble represents the CPC or CPM for the category. Larger bubbles have higher pricing.
The diagonal line indicates spending changes that are completely described by the change in pricing. Bubbles above the diagonal mean that ad volume—clicks for retail media and paid search, impressions for paid social—grew faster than pricing, while bubbles below the diagonal mean that volume grew slower.
Retail Media
Overall, retail media spending did not change in June, while the average CPC increased by 3%. Average spending per day rose 3%.
It was a mix of ups and downs both for spending and CPC in June. Apparel and Hobbies & Leisure saw the biggest month-over-month increases in spending, while Health and Beauty & Personal care expenditures dropped by high single-digit percentages.
Summer may be upon us when it comes to ad prices, as Family & Community–which includes baby and parenting–got more expensive and Business & Industrial–home of office supplies and other work-related subcategories–dropped by just over 5%. Vacation, anyone?

Paid Search
Overall paid search spending decreased 2% in June, while average CPC increased 2%. Average spending per day rose 2%.
Travel & Tourism had another strong month of spending growth as we head to summer, with budgets up almost 10% over May. Occasions & Gifts and Home & Garden saw the biggest decreases in spending. Home & Garden also had the largest drop in CPC, while Finance ad prices were up double digits.
Jobs & Education continues to dominate overall CPC, although Internet & Telecom also shows relatively high click prices. Commerce-focused categories like Apparel and Occasions & Gifts have relatively low CPC as a result of a greater share of lower-priced shopping ads.

Social Advertising
Overall, paid social spending dropped 5% in June, while average CPM grew 4%. Average spending per day dipped 2%.
The big drop in monthly spending in the Health category may have been driven by one large advertiser. Finance and Food & Groceries also saw budgets shrink compared to May, while Sports and Fitness showed robust growth.
News, Media & Publications segment had both the largest increase in monthly CPM and the highest CPM of all of our segments. Health and Finance both saw relatively large CPM decreases. The three categories that experienced a decline in both spending and CPM also saw fewer impressions, based on their position below the diagonal line.
Check out more resources from Skai
Come back next month for the most up-to-date data. Until then, you can dive into more of our research via our Skai Research Center or Quarterly Trends Reports hub.
And please visit the Skai blog and Whitepaper Library for ongoing insights, analysis, and interviews on all things related to digital advertising.