In the last 19 years, only 1.0 % trading sessions saw intraday declines higher than 5 % .
NTPC Share Price
Loading...
NTPC Share Price
Advertisment
NTPC share price insights
View All
Company has spent 6.75% of its operating revenues towards interest expenses and 3.69% towards employee cost in the year ending Mar 31, 2024. (Source: Consolidated Financials)
20 day moving crossover appeared on Sep 04, 2024. Average price decline of -2.08% within 7 days of this signal in last 5 years.
Stock gave a 3 year return of 244.66% as compared to Nifty 100 which gave a return of 49.32%. (as of last trading session)
NTPC Ltd. share price moved down by -0.46% from its previous close of Rs 405.10. NTPC Ltd. stock last traded price is 403.25
Share Price Value Today/Current/Last 403.25 Previous Day 405.10
Key Metrics
PE Ratio (x) | 18.26 | ||||||||||
EPS - TTM (₹) | 22.08 | ||||||||||
MCap (₹ Cr.) | 3,91,018 | ||||||||||
Sectoral MCap Rank | 1 | ||||||||||
PB Ratio (x) | 2.38 | ||||||||||
Div Yield (%) | 1.92 | ||||||||||
Face Value (₹) | 10.00 | ||||||||||
Beta Beta
| 1.02 | ||||||||||
VWAP (₹) | 404.19 | ||||||||||
52W H/L (₹) |
NTPC Share Price Returns
| 1 Day | -0.46% |
| 1 Week | -1.62% |
| 1 Month | -2.42% |
| 3 Months | 18.26% |
| 1 Year | 71.89% |
| 3 Years | 244.66% |
| 5 Years | 226.65% |
NTPC News & Analysis


NTPC Share Analysis
Unlock Stock Score, Analyst' Ratings & Recommendations

- View Stock Score on a 10-point scale
- See ratings on Earning, Fundamentals, Valuation, Risk & Price
- Check stock performance
JOIN ET PRIME
NTPC Share Recommendations
Recent Recos
BUY
Current
Mean Recos by 22 Analysts
Strong
SellSellHoldBuyStrong
Buy
SellSellHoldBuyStrong
Buy
That's all for NTPC recommendations. Check out other stock recos.
Analyst Trends
| Ratings | Current | 1 Week Ago | 1 Month Ago | 3 Months Ago |
|---|---|---|---|---|
| Strong Buy | 11 | 11 | 12 | 11 |
| Buy | 7 | 7 | 7 | 8 |
| Hold | 1 | 1 | 1 | - |
| Sell | 2 | 2 | 2 | 2 |
| Strong Sell | 1 | 1 | 1 | 1 |
| # Analysts | 22 | 22 | 23 | 22 |
View all
Stock Recommendations
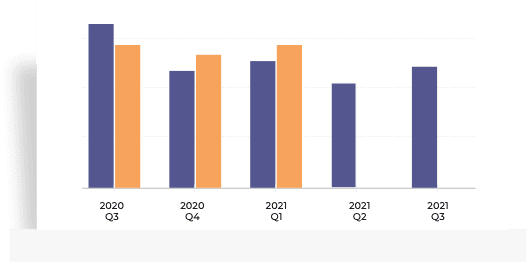
NTPC Financials
Income (P&L)
Balance Sheet
Cash Flow
Ratios
MD&A
Insights
Employee & Interest Expense
Company has spent 6.75% of its operating revenues towards interest expenses and 3.69% towards employee cost in the year ending Mar 31, 2024. (Source: Consolidated Financials)
Quarterly | Annual Jun 2024 Mar 2024 Dec 2023 Sep 2023 Jun 2023 Total Income 48,981.68 48,816.55 43,574.65 45,384.64 43,390.02 Total Income Growth (%) 0.34 12.03 -3.99 4.60 -3.03 Total Expenses 39,295.46 37,908.99 34,095.90 36,121.21 34,485.50 Total Expenses Growth (%) 3.66 11.18 -5.61 4.74 -3.85 EBIT 9,686.22 10,907.56 9,478.75 9,263.43 8,904.52 EBIT Growth (%) -11.20 15.07 2.32 4.03 0.29 Profit after Tax (PAT) 5,474.14 6,168.73 5,155.28 4,614.64 4,873.24 PAT Growth (%) -11.26 19.66 11.72 -5.31 0.26 EBIT Margin (%) 19.78 22.34 21.75 20.41 20.52 Net Profit Margin (%) 11.18 12.64 11.83 10.17 11.23 Basic EPS (₹) 5.65 6.36 5.32 4.76 5.03 All figures in Rs Cr, unless mentioned otherwise
Annual FY 2024 FY 2023 FY 2022 FY 2021 FY 2020 Total Assets 4,80,196.57 4,46,021.45 4,16,516.73 3,98,966.21 3,78,485.44 Total Assets Growth (%) 7.66 7.08 4.40 5.41 9.18 Total Liabilities 3,15,074.29 2,95,067.83 2,77,382.58 2,69,704.03 2,56,329.09 Total Liabilities Growth (%) 6.78 6.38 2.85 5.22 10.30 Total Equity 1,65,122.28 1,50,953.62 1,39,134.15 1,29,262.18 1,22,156.35 Total Equity Growth (%) 9.39 8.50 7.64 5.82 6.91 Current Ratio (x) 0.96 0.93 0.91 0.93 0.98 Total Debt to Equity (x) 1.46 1.50 1.55 1.57 1.62 Contingent Liabilities 4,27,806.67 3,89,024.57 1,01,896.02 1,26,940.73 1,14,256.83 All figures in Rs Cr, unless mentioned otherwise
Insights
Increase in Cash from Investing
Company has used Rs 32141.37 cr for investing activities which is an YoY increase of 23.11%. (Source: Consolidated Financials)
Annual FY 2024 FY 2023 FY 2022 FY 2021 FY 2020 Net Cash flow from Operating Activities 40,784.59 40,051.55 41,788.23 32,444.06 24,583.22 Net Cash used in Investing Activities -32,141.37 -26,107.20 -22,838.24 -21,034.45 -30,321.67 Net Cash flow from Financing Activities -8,245.53 -14,154.47 -19,171.56 -11,049.11 6,004.26 Net Cash Flow 397.69 -210.12 -221.57 360.50 265.78 Closing Cash & Cash Equivalent 863.34 465.65 728.45 950.02 589.52 Closing Cash & Cash Equivalent Growth (%) 85.41 -36.08 -23.32 61.15 82.10 Total Debt/ CFO (x) 5.76 5.49 5.01 6.08 7.83 All figures in Rs Cr, unless mentioned otherwise
Annual FY 2024 FY 2023 FY 2022 FY 2021 FY 2020 Return on Equity (%) 12.95 11.50 12.31 11.63 9.76 Return on Capital Employed (%) 9.93 9.68 8.53 7.84 7.74 Return on Assets (%) 4.33 3.79 4.00 3.66 3.06 Interest Coverage Ratio (x) 4.46 4.44 4.57 2.77 2.97 Asset Turnover Ratio (x) 0.39 0.41 0.31 27.95 28.92 Price to Earnings (x) 15.67 10.05 7.85 7.06 7.18 Price to Book (x) 2.03 1.16 0.97 0.82 0.70 EV/EBITDA (x) 10.39 7.85 7.97 7.89 8.01 EBITDA Margin (%) 30.11 28.09 32.11 34.06 31.46 MANAGEMENT DISCUSSION AND ANALYSIS (FY 19-20)
Power sector reform
During the year 2019-20, the major reforms in the power sector are: Proposed amendments in Electricity Act with elements such as formulation of National Renewable Energy Policy, setting up of Electricity Contract Enforcement Authority. Tariff determination with Direct benefit transfer of subsidy by State Governments.. Implementation of Payment Security Mechanism through LC.. Smart Metering, Setting up of Renewable Energy Management Centre (REMC).
Possible disruption due to Covid
The electricity consumption being dependent on the economic activities in the country has seen a dip in the demand during the period of lockdown. COVID-19 has also affected the supply chain, workforce availability, land acquisition and cashflows of your Company which may affect the timely execution of the under-construction projects adversely affecting the growth plans
Environmental challenges set to increase
The environmental concerns particularly relating to coal based thermal stations have emerged as a major challenge to the sector. In December 2015, MOEF&CC notified the new standards for water consumption, particulate matter, SOX, NOX and mercury for thermal power stations.
NTPC Share Price Forecast
PRICE
REVENUE
EARNINGS
Get multiple analysts’ prediction on NTPC
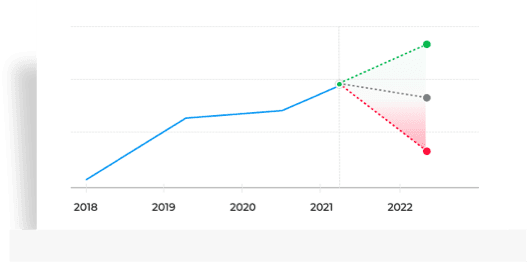
- High, low, medium predictions for Price
- Upcoming predictions for Revenue
- Details about company earnings
START FREE TRIALGet multiple analysts’ prediction on NTPC
- High, low, medium predictions for Price
- Upcoming predictions for Revenue
- Details about company earnings
START FREE TRIALGet multiple analysts’ prediction on NTPC
- High, low, medium predictions for Price
- Upcoming predictions for Revenue
- Details about company earnings
START FREE TRIAL
NTPC Peer Comparison
NTPC Stock Performance
Ratio Performance
Insights
Stock Returns vs Nifty 100
Stock gave a 3 year return of 244.66% as compared to Nifty 100 which gave a return of 49.32%. (as of last trading session)Stock Returns vs BSE Power
Stock generated 244.66% return as compared to BSE Power which gave investors 171.09% return over 3 year time period. (as of last trading session)
Choose from Peers
Choose from Stocks
- 1D
- 1W
- 1M
- 3M
- 6M
- 1Y
- 5Y
Loading...Insights
Stock Returns vs Nifty 100
Stock gave a 3 year return of 244.66% as compared to Nifty 100 which gave a return of 49.32%. (as of last trading session)Stock Returns vs BSE Power
Stock generated 244.66% return as compared to BSE Power which gave investors 171.09% return over 3 year time period. (as of last trading session)
See All Parameters
MF Ownership
CPSE ETF-G
Equity: Thematic-PSU
9,608.66
Amount Invested (in Cr.)
20.53%
% of AUM
-0.53
% Change (MoM basis)
2,987.52
Amount Invested (in Cr.)
3.18%
% of AUM
-2.55
% Change (MoM basis)
2,877.43
Amount Invested (in Cr.)
7.36%
% of AUM
0.00
% Change (MoM basis)
MF Ownership as on 31 July 2024
NTPC F&O Quote
Futures
Options
- Expiry
Price
405.55-1.55 (-0.38%)
Open Interest
2,49,00049,500 (19.88%)
Open High Low Prev Close Contracts Traded Turnover (₹ Lakhs) 408.30 410.00 403.60 407.10 14,429 87,968.87 Open Interest as of 05 Jul 2024
Corporate Actions
NTPC Board Meeting/AGM
NTPC Dividends
- Others
Meeting Date Announced on Purpose Details Jul 27, 2024 Jul 24, 2024 Board Meeting Quarterly Results Jun 29, 2024 Jun 25, 2024 Board Meeting Others May 24, 2024 May 16, 2024 Board Meeting Audited Results & Final Dividend Jan 29, 2024 Jan 19, 2024 Board Meeting Quarterly Results & 2nd Interim Dividend Oct 28, 2023 Oct 19, 2023 Board Meeting Quarterly Results & Interim Dividend Type Dividend Dividend per Share Ex-Dividend Date Announced on Final 32% 3.25 Aug 07, 2024 May 24, 2024 Interim 22% 2.25 Feb 06, 2024 Jan 19, 2024 Interim 22% 2.25 Nov 03, 2023 Oct 19, 2023 Final 30% 3.0 Aug 11, 2023 May 19, 2023 Interim 42% 4.25 Feb 03, 2023 Jan 18, 2023 All Types Ex-Date Record Date Announced on Details Bonus Mar 19, 2019 Mar 20, 2019 Jan 30, 2019 Bonus Ratio: 1 share(s) for every 5 shares held
About NTPC
NTPC Ltd., incorporated in the year 1975, is a Large Cap company (having a market cap of Rs 391,018.06 Crore) operating in Power sector. NTPC Ltd. key Products/Revenue Segments include Generation Of Electricity, Other Operating Revenue, Consultancy Income and Lease Rentals for the year ending 31-Mar-2024. Show More
Executives
Auditors
- GS
Gurdeep Singh
Chairman & Managing DirectorPSPiyush Singh
Government Nominee DirectorJJJitendra Jayantilal Tanna
Independent DirectorSVSangitha Varier
Independent DirectorVVVidyadhar Vaishampayan
Independent DirectorVGVivek Gupta
Independent DirectorShow More - M C Bhandari & Co.JKSS & AssociatesVinod Kumar & AssociatesS N Kapur & Associates
Industry
Key Indices Listed on
Nifty 50, BSE Sensex, Nifty 100, + 44 more
Address
NTPC Bhawan,SCOPE Complex,New Delhi, Delhi - 110003
More Details
Brands

NTPC
Trending in Markets
DATA SOURCES: TickerPlant (for live BSE/NSE quotes service) and Dion Global Solutions Ltd. (for corporate data, historical price & volume, F&O data). Sensex & BSE Quotes and Nifty & NSE Quotes are real-time and licensed from BSE and NSE respectively. All timestamps are reflected in IST (Indian Standard Time).
DISCLAIMER: Any and all content on this website including tools/analysis is provided to you only for convenience and on an “as-is, as- available” basis without representation and warranties of any kind. The content and any output of such tools/analysis is for informational purposes only and should not be relied upon or construed as an investment advice or guarantee for any specific performance/returns advice or considered as recommendation for the purchase or sale of any security or investment. You are advised to exercise caution, discretion and independent judgment with regards to the same and seek advice from professionals and certified experts before taking any decisions.
By using this site, you agree to the Terms of Service and Privacy Policy.