Bullish signal on daily chart
Sales de-grew by 3.12%. Company witnessed revenue contraction for the first time in last 3 years. (Source: Consolidated Financials)
Sales de-grew by 3.12%. Company witnessed revenue contraction for the first time in last 3 years. (Source: Consolidated Financials)
Black Spinning Top was formed for Hindalco
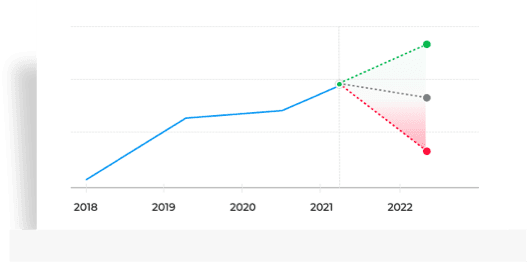
Stock gave a 3 year return of 53.3% as compared to Nifty 100 which gave a return of 43.3%. (as of last trading session)
Company has spent 1.79% of its operating revenues towards interest expenses and 6.84% towards employee cost in the year ending Mar 31, 2024. (Source: Consolidated Financials)
Hindalco Industries Ltd. share price moved down by -0.59% from its previous close of Rs 747.35. Hindalco Industries Ltd. stock last traded price is 743.00
| Share Price | Value |
|---|---|
| Today/Current/Last | 743.00 |
| Previous Day | 747.35 |
PE Ratio (x) | 15.50 | ||||||||||
EPS - TTM (₹) | 47.95 | ||||||||||
MCap (₹ Cr.) | 1,66,968 | ||||||||||
Sectoral MCap Rank | 2 | ||||||||||
PB Ratio (x) | 1.58 | ||||||||||
Div Yield (%) | 0.47 | ||||||||||
Face Value (₹) | 1.00 | ||||||||||
Beta Beta
| 1.43 | ||||||||||
VWAP (₹) | 745.83 | ||||||||||
52W H/L (₹) |
| 1 Day | -0.59% |
| 1 Week | 1.6% |
| 1 Month | 10.36% |
| 3 Months | 7.36% |
| 1 Year | 54.6% |
| 3 Years | 43.96% |
| 5 Years | 293.75% |
 Stock Radar: Metal stocks in focus! Why short-term traders should buy Hindalco
 F&O Strategy: How to trade Hindalco and Power Grid
 India's Hindalco plans to enter solar module manufacturing, sources say
Compliances-Reg. 39 (3) - Details of Loss of Certificate / Duplicate Certificate
Announcements
Current
Mean Recos by 25 Analysts
| Ratings | Current | 1 Week Ago | 1 Month Ago | 3 Months Ago |
|---|---|---|---|---|
| Strong Buy | 13 | 13 | 13 | 11 |
| Buy | 10 | 10 | 10 | 10 |
| Hold | 1 | 1 | 1 | 2 |
| Sell | 1 | 1 | 1 | 1 |
| Strong Sell | - | - | - | - |
| # Analysts | 25 | 25 | 25 | 24 |
Topline Contraction
Sales de-grew by 3.12%. Company witnessed revenue contraction for the first time in last 3 years. (Source: Consolidated Financials)Employee & Interest Expense
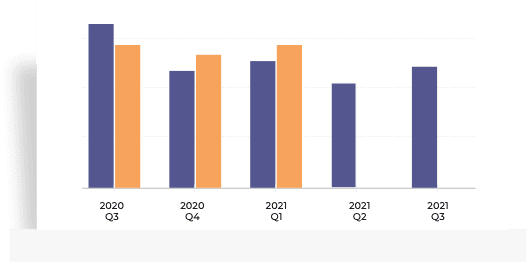
Company has spent 1.79% of its operating revenues towards interest expenses and 6.84% towards employee cost in the year ending Mar 31, 2024. (Source: Consolidated Financials)| Quarterly | Annual | Jun 2024 | Mar 2024 | Dec 2023 | Sep 2023 | Jun 2023 |
|---|---|---|---|---|---|
| Total Income | 57,437.00 | 56,356.00 | 53,088.00 | 54,632.00 | 53,382.00 |
| Total Income Growth (%) | 1.92 | 6.16 | -2.83 | 2.34 | -5.03 |
| Total Expenses | 51,732.00 | 51,331.00 | 48,817.00 | 50,367.00 | 49,075.00 |
| Total Expenses Growth (%) | 0.78 | 5.15 | -3.08 | 2.63 | -6.32 |
| EBIT | 5,705.00 | 5,025.00 | 4,271.00 | 4,265.00 | 4,307.00 |
| EBIT Growth (%) | 13.53 | 17.65 | 0.14 | -0.98 | 12.66 |
| Profit after Tax (PAT) | 3,074.00 | 3,174.00 | 2,331.00 | 2,196.00 | 2,454.00 |
| PAT Growth (%) | -3.15 | 36.16 | 6.15 | -10.51 | 1.78 |
| EBIT Margin (%) | 9.93 | 8.92 | 8.05 | 7.81 | 8.07 |
| Net Profit Margin (%) | 5.35 | 5.63 | 4.39 | 4.02 | 4.60 |
| Basic EPS (₹) | 13.84 | 14.29 | 10.50 | 9.88 | 11.05 |
All figures in Rs Cr, unless mentioned otherwise
| Annual | FY 2024 | FY 2023 | FY 2022 | FY 2021 | FY 2020 |
|---|---|---|---|---|---|
| Total Assets | 2,31,907.00 | 2,24,817.00 | 2,23,062.00 | 1,89,699.00 | 1,69,528.00 |
| Total Assets Growth (%) | 3.15 | 0.79 | 17.59 | 11.90 | 11.07 |
| Total Liabilities | 1,25,750.00 | 1,30,000.00 | 1,44,860.00 | 1,23,156.00 | 1,11,201.00 |
| Total Liabilities Growth (%) | -3.27 | -10.26 | 17.62 | 10.75 | 16.91 |
| Total Equity | 1,06,153.00 | 94,813.00 | 78,198.00 | 66,539.00 | 58,323.00 |
| Total Equity Growth (%) | 11.96 | 21.25 | 17.52 | 14.09 | 1.42 |
| Current Ratio (x) | 1.39 | 1.48 | 1.28 | 1.39 | 1.78 |
| Total Debt to Equity (x) | 0.51 | 0.62 | 0.81 | 0.98 | 1.15 |
| Contingent Liabilities | 88,564.00 | 1,34,161.00 | 98,014.00 | 75,698.00 | 69,188.00 |
All figures in Rs Cr, unless mentioned otherwise
Increase in Cash from Investing
Company has used Rs 14276.0 cr for investing activities which is an YoY increase of 75.79%. (Source: Consolidated Financials)| Annual | FY 2024 | FY 2023 | FY 2022 | FY 2021 | FY 2020 |
|---|---|---|---|---|---|
| Net Cash flow from Operating Activities | 24,056.00 | 19,208.00 | 16,838.00 | 17,232.00 | 12,745.00 |
| Net Cash used in Investing Activities | -14,276.00 | -8,121.00 | -7,074.00 | -25,637.00 | -8,427.00 |
| Net Cash flow from Financing Activities | -10,817.00 | -10,345.00 | -6,765.00 | -4,882.00 | 6,656.00 |
| Net Cash Flow | -1,028.00 | 1,199.00 | 3,300.00 | -12,930.00 | 12,174.00 |
| Closing Cash & Cash Equivalent | 11,810.00 | 12,838.00 | 11,639.00 | 8,339.00 | 21,269.00 |
| Closing Cash & Cash Equivalent Growth (%) | -8.01 | 10.30 | 39.57 | -60.79 | 133.74 |
| Total Debt/ CFO (x) | 2.27 | 3.04 | 3.76 | 3.77 | 5.26 |
All figures in Rs Cr, unless mentioned otherwise
| Annual | FY 2024 | FY 2023 | FY 2022 | FY 2021 | FY 2020 |
|---|---|---|---|---|---|
| Return on Equity (%) | 9.56 | 10.65 | 17.56 | 5.23 | 6.45 |
| Return on Capital Employed (%) | 10.34 | 10.24 | 15.60 | 8.59 | 7.86 |
| Return on Assets (%) | 4.37 | 4.49 | 6.15 | 1.83 | 2.22 |
| Interest Coverage Ratio (x) | 6.58 | 6.56 | 7.82 | 5.02 | 2.48 |
| Asset Turnover Ratio (x) | 0.95 | 0.48 | 0.47 | 0.33 | 69.68 |
| Price to Earnings (x) | 12.25 | 8.91 | 9.22 | 20.83 | 5.64 |
| Price to Book (x) | 1.17 | 0.95 | 1.62 | 1.09 | 0.36 |
| EV/EBITDA (x) | 6.48 | 5.56 | 5.84 | 6.87 | 4.31 |
| EBITDA Margin (%) | 11.74 | 10.71 | 15.11 | 14.21 | 13.11 |
Bullish / Bearish signals for Hindalco basis selected technical indicators and moving average crossovers.
5 Day EMA Crossover
Bullish signal on daily chart
Appeared on: 11 Oct 2024
5D EMA: 736.85
| Date | 7 days Gain/Loss % |
|---|---|
| 12 Sep 2024 | 2.34% |
| 16 Aug 2024 | 9.85% |
| 12 Aug 2024 | 0.80% |
| 31 Jul 2024 | 3.18% |
Average price gain of 3.73% within 7 days of Bullish signal in last 5 years
10 Day EMA Crossover
Bullish signal on daily chart
Appeared on: 11 Oct 2024
10D EMA: 733.36
| Date | 7 days Gain/Loss % |
|---|---|
| 12 Sep 2024 | 2.34% |
| 16 Aug 2024 | 9.85% |
| 31 Jul 2024 | 3.18% |
| 15 Jul 2024 | 0.44% |
Average price gain of 3.87% within 7 days of Bullish signal in last 5 years
| R1 | R2 | R3 | PIVOT | S1 | S2 | S3 | |
|---|---|---|---|---|---|---|---|
| Classic | 753.85 | 760.35 | 777.25 | 743.45 | 736.95 | 726.55 | 709.65 |
| 5 DAYS | 14 DAYS | 28 DAYS | |
|---|---|---|---|
| ATR | 20.82 | 19.72 | 19.06 |
Stock Returns vs Nifty 100
Stock gave a 3 year return of 53.3% as compared to Nifty 100 which gave a return of 43.3%. (as of last trading session)Stock Returns vs Nifty Metal
Stock generated 53.3% return as compared to Nifty Metal which gave investors 70.64% return over 3 year time period. (as of last trading session)Choose from Peers
Choose from Stocks
Stock Returns vs Nifty 100
Stock gave a 3 year return of 53.3% as compared to Nifty 100 which gave a return of 43.3%. (as of last trading session)Stock Returns vs Nifty Metal
Stock generated 53.3% return as compared to Nifty Metal which gave investors 70.64% return over 3 year time period. (as of last trading session)1,753.38
Amount Invested (in Cr.)
2.39%
% of AUM
0.00
% Change (MoM basis)
727.41
Amount Invested (in Cr.)
1.13%
% of AUM
0.44
% Change (MoM basis)
700.21
Amount Invested (in Cr.)
1.36%
% of AUM
0.00
% Change (MoM basis)
MF Ownership as on 31 August 2024
| Meeting Date | Announced on | Purpose | Details |
|---|---|---|---|
| Nov 11, 2024 | Sep 27, 2024 | Board Meeting | Quarterly Results |
| Aug 13, 2024 | Jun 28, 2024 | Board Meeting | Quarterly Results |
| May 24, 2024 | Apr 01, 2024 | Board Meeting | Audited Results |
| Mar 22, 2024 | Feb 20, 2024 | POM | - |
| Feb 13, 2024 | Dec 29, 2023 | Board Meeting | Quarterly Results |
| Type | Dividend | Dividend per Share | Ex-Dividend Date | Announced on |
|---|---|---|---|---|
| Final | 350% | 3.5 | Aug 09, 2024 | May 24, 2024 |
| Final | 300% | 3.0 | Aug 14, 2023 | May 24, 2023 |
| Final | 400% | 4.0 | Aug 11, 2022 | May 26, 2022 |
| Final | 300% | 3.0 | Aug 12, 2021 | May 21, 2021 |
| Final | 100% | 1.0 | Sep 03, 2020 | Jun 12, 2020 |
| All Types | Ex-Date | Record Date | Announced on | Details |
|---|---|---|---|---|
| Rights | Aug 28, 2008 | - | Jun 20, 2008 | Rights ratio: 3 share for every 7 held at a price of Rs 96.0 |
| Rights | Nov 21, 2005 | Nov 28, 2005 | Sep 20, 2005 | Rights ratio: 1 share for every 4 held at a price of Rs 96.0 |
| Splits | Aug 30, 2005 | Sep 06, 2005 | Jul 12, 2005 | Split: Old FV10.0| New FV:1.0 |
| Bonus | Sep 02, 1996 | Sep 27, 1996 | May 10, 1996 | Bonus Ratio: 1 share(s) for every 2 shares held |
| Bonus | Sep 03, 1990 | - | Sep 11, 1990 | Bonus Ratio: 3 share(s) for every 5 shares held |
Hindalco Industries Ltd., incorporated in the year 1958, is a Large Cap company (having a market cap of Rs 167,945.73 Crore) operating in Metals - Non Ferrous sector. Hindalco Industries Ltd. key Products/Revenue Segments include Copper/Copper Products, Aluminium, Other Operating Revenue, Sale of services for the year ending 31-Mar-2024. Show More
Kumar Mangalam Birla
Non Executive ChairmanKumar Mangalam Birla
Non Executive ChairmanSatish Pai
Managing DirectorSatish Pai
Managing DirectorIndustry
Key Indices Listed on
Nifty 50, Nifty 100, Nifty 200, + 35 more
Address
21st Floor, One International Centre,Tower 4, Near Prabhadevi Railway Station,Senapati Bapat Marg, Prabhadevi,Mumbai, Maharashtra - 400013
DATA SOURCES: TickerPlant (for live BSE/NSE quotes service) and Dion Global Solutions Ltd. (for corporate data, historical price & volume, F&O data). Sensex & BSE Quotes and Nifty & NSE Quotes are real-time and licensed from BSE and NSE respectively. All timestamps are reflected in IST (Indian Standard Time).
DISCLAIMER: Any and all content on this website including tools/analysis is provided to you only for convenience and on an “as-is, as- available” basis without representation and warranties of any kind. The content and any output of such tools/analysis is for informational purposes only and should not be relied upon or construed as an investment advice or guarantee for any specific performance/returns advice or considered as recommendation for the purchase or sale of any security or investment. You are advised to exercise caution, discretion and independent judgment with regards to the same and seek advice from professionals and certified experts before taking any decisions.
By using this site, you agree to the Terms of Service and Privacy Policy.