Showing posts with label Excess Returns. Show all posts

Wednesday, January 31, 2024

Data Update 5 for 2024: Profitability - The End Game for Business?

In my last three posts, I looked at the macro (equity risk premiums, default spreads, risk free rates) and micro (company risk measures) that feed into the expected returns we demand on investments, and argued that these expected returns become hurdle rates for businesses, in the form of costs of equity and capital. Since businesses invest that capital in their operations, generally, and in individual projects (or assets), specifically, the big question is whether they generate enough in profits to meet these hurdle rate requirements. In this post, I start by looking at the end game for businesses, and how that choice plays out in investment rules for these businesses, and then examine how much businesses generated in profits in 2023, scaled to both revenues and invested capital. 

The End Game in Business

    If you start a business, what is your end game? Your answer to that question will determine not just how you approach running the business, but also the details of how you pick investments, choose a financing mix and decide how much to return to shareholders, as dividend or buybacks. While private businesses are often described as profit maximizers, the truth is that if they should be value maximizers. In fact, that objective of value maximization drives every aspect of the business, as can be seen in this big picture perspective in corporate finance:

For some companies, especially mature ones, value and profit maximization may converge, but for most, they will not. Thus, a company with growth potential may be willing to generate less in profits now, or even make losses, to advance its growth prospects. In fact, the biggest critique of the companies that have emerged in this century, many in social media, tech and green energy, is that they have  prioritized scaling up and growth so much that they have failed to pay enough attention to their business models and profitability.

    For decades, the notion of maximizing value has been central to corporate finance, though there have been disagreements about whether maximizing stock prices would get you the same outcome, since that latter requires assumptions about market efficiency. In the last two decades, though, there are many who have argued that maximizing value and stockholder wealth is far too narrow an objective, for businesses, because it puts shareholders ahead of the other stakeholders in enterprises:


It is the belief that stockholder wealth maximization shortchanges other stakeholders that has given rise to stakeholder wealth maximization, a misguided concept where the end game for businesses is redefined to maximize the interests of all stakeholders. In addition to being impractical, it misses the fact that shareholders are given primacy in businesses because they are the only claim holders that have no contractual claims against the business, accepting  residual cash flows, If stakeholder wealth maximization is allowed to play out, it will result in confused corporatism, good for top managers who use stakeholder interests to become accountable to none of the stakeholders:


As you can see, I am not a fan of confused corporatism, arguing that giving a business multiple objectives will mangle decision making, leaving businesses looking like government companies and universities, wasteful entities unsure about their missions. In fact, it is that skepticism that has made me a critic of ESG and sustainability, offshoots of stakeholder wealth maximization, suffering from all of its faults, with greed and messy scoring making them worse. 

    It may seem odd to you that I am spending so much time defending the centrality of profitability  to a business, but it is a sign of how distorted this discussion has become that it is even necessary. In fact, you may find my full-throated defense of generating profits and creating value to be distasteful, but if you are an advocate for the point of view that businesses have broader social purposes, the reality is that for businesses to do good, they have  to be financial healthy and profitable. Consequently, you should be just as interested, as I am, in the profitability of companies around the world, albeit for different reasons. My interest is in judging them on their capacity to generate value, and yours would be to see if they are generating enough as surplus so that they can do good for the world. 

Profitability: Measures and Scalars

   Measuring profitability at a business is messier than you may think, since it is not just enough for a business to make money, but it has to make enough money to justify the capital invested in it. The first step is understanding profitability is recognizing that there are multiple measures of profit, and that each measure they captures a different aspect of a business:


It is worth emphasizing that these profit numbers reflect two influences, both of which can skew the numbers. The first is the explicit role of accountants in measuring profits implies that inconsistent accounting rules will lead to profits being systematically mis-measured, a point I have made in my posts on how R&D is routinely mis-categorized by accountants. The other is the implicit effect of tax laws, since taxes are based upon earnings, creating an incentive to understate earnings or even report losses, on the part of some businesses. That said, global (US) companies collectively generated $5.3 trillion ($1.8 trillion) in net income in 2023, and the pie charts below provide the sector breakdowns for global and US companies:


Notwithstanding their trials and tribulations since 2008, financial service firms (banks, insurance companies, investment banks and brokerage firms) account for the largest slice of the income pie, for both US and global companies, with energy and technology next on the list.

Profit Margins

    While aggregate income earned is an important number, it is an inadequate measure of profitability, especially when comparisons across firms, when it is not scaled to something that companies share. As as a first scalar, I look at profits, relative to revenues, which yields margins, with multiple measures, depending upon the profit measure used:

Looking across US and global companies, broken down by sector, I  look at profit margins in 2023:

Note that financial service companies are conspicuously absent from the margin list, for a simple reason. Most financial service firms have no revenues, though they have their analogs - loans for banks, insurance premiums for insurance companies etc. Among the sectors, energy stands out, generating the highest margins globally, and the second highest, after technology firms in the United States. Before the sector gets targeted as being excessively profitable, it is also one that is subject to volatility, caused by swings in oil prices; in 2020, the sector was the worst performing on profitability, as oil prices plummeted that year.
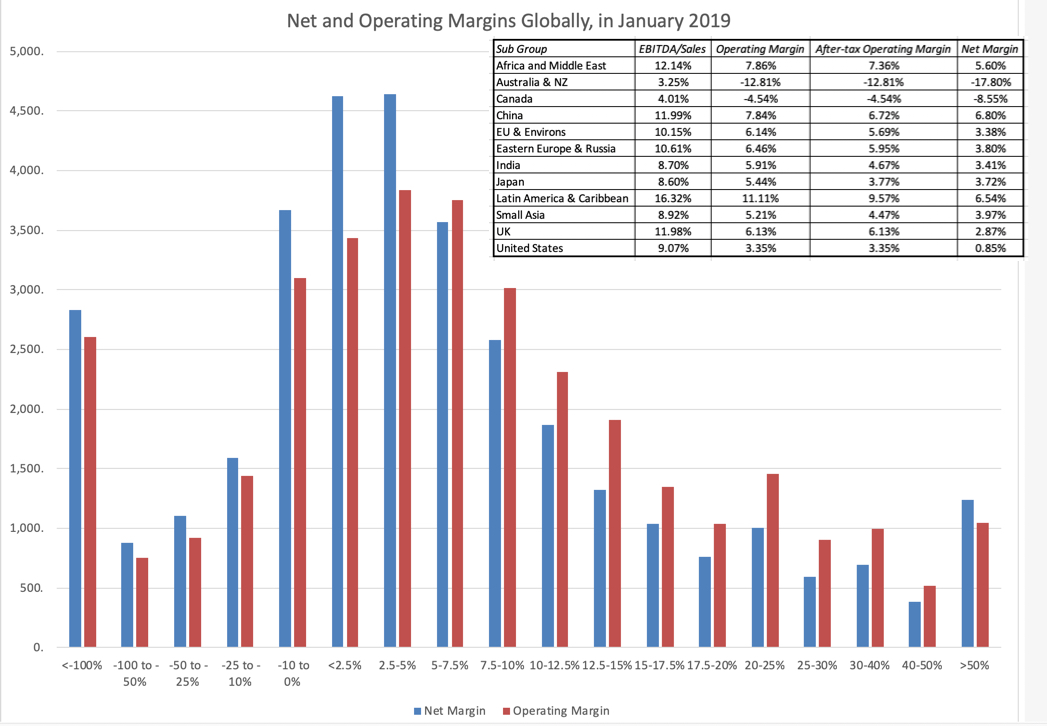
    Does profitability vary across the globe? To answer that question, I look at differences in margins across sub-regions of the world:

You may be surprised to see Eastern European and Russian companies with the highest margins in the world, but that can be explained by two phenomena. The first is the preponderance of natural resource companies in this region, and energy companies had a profitable year in 2023. The second is that the sanctions imposed after 2021 on doing business in Russia drove  foreign competitors out of the market, leaving the market almost entirely to domestic companies. At the other end of the spectrum, Chinese and Southeast Asian companies have the lowest net margins, highlighting the reality that big markets are not always profitable ones.
  Finally, there is a relationship between corporate age and profitability, with younger companies often struggling more to deliver profits, with business models still in flux and no economies of scale. In the fact, the pathway of a company through the life cycle can be seen through the lens of profit margins:


Early in the life cycle, the focus will be on gross margins, partly because there are losses on almost every other earnings measure. As companies enter growth, the focus will shift to operating margins, albeit before taxes, as companies still are sheltered from paying taxes by past losses. In maturity, with debt entering the financing mix, net margins become good measures of profitability, and in decline, as earnings decline and capital expenditures ease, EBITDA margins dominate. In the table below, I look at global companies, broken down into decals, based upon corporate age, and compute profit margins across the deciles:

The youngest companies hold their own on gross and EBITDA margins, but they drop off as you move to operating nnd net margins.
    In summary, profit margins are a useful measure of profitability, but they vary across sectors for many reasons, and you can have great companies with low margins and below-average companies that have higher margins. Costco has sub-par operating margins, barely hitting 5%, but makes up for it with high sales volume, whereas there are luxury retailers with two or three times higher margins that struggle to create value.

Return on Investment

    The second scalar for profits is the capital invested in the assets that generate these profits. Here again, there are two paths to measuring returns on investment, and the best way to differentiate them is to think of them in the context of a financial balance sheet:


The accounting return on equity is computed by dividing the net income, the equity investor's income measure, by the book value of equity and the return on invested capital is computed, relative to the book value of invested capital, the cumulative values of book values of equity and debt, with cash netted out. Looking at accounting returns, broken down by sector, for US and global companies, here is what 2023 delivered:


In both the US and globally, technology companies deliver the highest accounting returns, but these returns are skewed by the accounting inconsistencies in capitalizing R&D expenses. While I partially correct for this by capitalizing R&D expenses, it is only a partial correction, and the returns are still overstated. The worst accounting returns are delivered by real estate companies, though they too are skewed by tax considerations, with expensing  to reduce taxes paid, rather than getting earnings right.

Excess Returns

    In the final assessment, I bring together the costs of equity and capital estimated in the last post and the accounting returns in this one, to answer a critical question that every business faces, i.e,, whether the returns earned on its investment exceed its hurdle rate. As with the measurement of returns, excess returns require consistent comparisons, with accounting returns on equity compared to costs of equity, and returns on capital to costs of capital:

These excess returns are not perfect or precise, by any stretch of the imagination, with mistakes made in assessing risk parameters (betas and ratings) causing errors in the cost of capital and accounting choices and inconsistencies affecting accounting returns. That said, they remain noisy estimates of a company's competitive advantages and moats, with strong moats going with positive excess returns, no moats translating into excess returns close to zero and bad businesses generating negative excess returns.
    I start again by looking at the sector breakdown,  both US and global, of excess returns in 2023, in the table below:

In computing excess returns, I did add a qualifier, which is that I would do the comparison only among money making companies; after all, money losing companies will have accounting returns that are negative and less than hurdle rates. With each sector, to assess profitability, you have to look at the percentage of companies that make money and then at the percent of these money making firms that earn more than the hurdle rate. With financial service firms, where only the return on equity is meaningful, 57% (64%) of US (global) firms have positive net income, and of these firms, 82% (60%) generated returns on equity that exceeded their cost of equity. In contrast, with health care firms, only 13% (35%) of US (global) firms have positive net income, and about 68% (53%) of these firms earn returns on equity that exceed the cost of equity.  
    In a final cut, I looked at excess returns by region of the world, again looking at only money-making companies in each region:

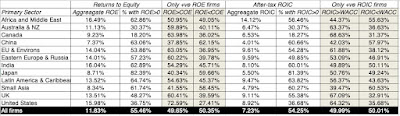
To assess the profitability of companies in each region, I again look at t the percent of companies that are money-making, and then at the percent of these money-making companies that generate accounting returns that exceed the cost of capital. To provide an example, 82% of Japanese companies make money, the highest percentage of money-makers in the world, but only 40% of these money-making companies earn returns that exceed the hurdle rate, second only to China on that statistic. The US has the highest percentage (73%) of money-making companies that generate returns on equity that exceed their hurdle rates, but only 37% of US companies have positive net income. Australian and Canadian companies stand out again, in terms of percentages of companies that are money losers, and out of curiosity, I did take a closer look at the individual companies in these markets. It turns out that the money-losing is endemic among smaller publicly traded companies in these markets, with many operating in materials and mining, and the losses reflect both company health and life cycle, as well as the tax code (which allows generous depreciation of assets). In fact, the largest companies in Australia and Canada deliver enough profits to carry the aggregated accounting returns (estimated by dividing the total earnings across all companies by the total invested capital) to respectable levels.
    In the most sobering statistic, if you aggregate money-losers with the companies that earn less than their hurdle rates, as you should, there is not a single sector or region of the world, where a majority of firms earn more than their hurdle rates

In 2023, close to 80% of all firms globally earned returns on capital that lagged their costs of capital. Creating value is clearly far more difficult in practice than on paper or in case studies!

A Wrap!

I started this post by talking about the end game in business, arguing for profitability as a starting point and value as the end goal. The critics of that view, who want to expand the end game to include more stakeholders and a broader mission (ESG, Sustainability) seem to be operating on the presumption that shareholders are getting a much larger slice of the pie than they deserve. That may be true, if you look at the biggest winners in the economy and markets, but in the aggregate, the game of business has only become harder to play over time, as globalization has left companies scrabbling to earn their costs of capital. In fact, a decade of low interest rates and inflation have only made things worse, by making risk capital accessible to young companies, eager to disrupt the status quo.

YouTube Video


Datasets

  1. Profit Margins, by Industry (US, Global)
  2. Accounting Returns and Excess Returns, by Industry (US, Global)

Saturday, March 21, 2020

Data Update 6 for 2020: Profitability, Returns and the value of Growth

In an age, where scaling up and growth seems to have won out over building business models and profitability, as the most desirable business traits, it is worth stating the obvious. The measure of a good business is its capacity to generate not just profits, but also to convert these profits into cash flows that investors can collect. If we needed a reminder of this age-old premise, the last three weeks should have provided a wake-up call. In fact, if your central concern is about the negative economic consequences of the viral meltdown, in the short and the long term, higher growth and margin  companies will be best suited to not just survive them, but emerge stronger in the post-virus economy. In this post, I will try to look at growth, earnings and cash flows, and how they interact in value, and use that framework to examine how companies around the world, in different sectors, measure up. 

Growth, Profits and Cash Flows
The trickiest part of valuation is negotiating a balance between growth, profitability and reinvestment, with a plausible story holding them together, to derive value.
  • The Scaling Factor: Growth plays the 'good guy' role, allowing small companies to become big, and big firms to become even bigger.  While a growth rate can be computed on any metric, the metric that best reflects operating growth is revenue growth, accomplished by either selling more units or raising prices.
  • The Profitability Driver: Growth, by itself, can only scale up a firm's operations and revenues, but for that scaling up to pay off, it has to become profitable. Again, while there are many measures of profitability, scaling profits to revenues to arrive at profit margins makes the most sense.
  • The Reinvestment Lever: To grow, a company has to reinvest in capacity, in whatever form, and this reinvestment can drain cash flows. This reinvestment can be tied to earnings, as a retention ratio or a reinvestment rate, or to sales, as a sales to invested capital ratio.
If that sounds familiar, it is perhaps because you have seen me value many companies on this blog, using these three variables, added on to a risk component, to value companies as diverse as Kraft Heinz to Tesla to Beyond Meat. In fact, the cash flows that you observe for a firm can be captured by the interactions between these three forces, and those interactions let us differentiate between great, average and bad firms:

The extremes represent the best and worst possible combinations of these variables. Great firms pull off the trifecta, scaling up revenues with relatively little reinvestment, while deliver high margins. Terrible firms are saddled with the worst possible mix of low revenue growth, low or even negative margins and large capital investment requirements to deliver even their growth. The bulk of the business world falls in the middle, facing tradeoffs that determine value. Some trade off low margins for high growth, hoping that the dollar profits they deliver will be large enough, simply because of scale. Others are willing to reinvest more in the short term, to build barriers to entry and generate higher and more sustainable margins and returns for the long term.  In the rest of this post, I plan to look at how companies around the world measure up on each of these dimensions, beginning with the growth that they have recorded in the recent past, moving on to measures of profitability and ending with reinvestment numbers. I will then close by bringing in the hurdle rates that I estimated in my last post as benchmarks, to measure how firms measure up on value creation or destruction.

Growth 
The first variable that I will look at is growth, and focus primarily on past growth in different metrics, ranging from revenues (the top line) to net income (the bottom line). Along the way, I will argue that the way growth rates are estimated and the periods used for the estimation can have large effects on the numbers that emerge, and that bias, as with everything else in valuation, can affect choices.

Growth Metrics
Investors often make the mistake of assuming that, since the past is behind the, a historical growth rate for a company is a fact, not an estimate. That is a myth, since the historical growth rate that is reported for a company is a function of multiple choices made on estimation, as can be seen in the picture below:

So what? First, it is worth remembering that that the biases an investor brings to the table will often determine how, and in what metric, growth is computed. In general, at least in good times, earnings per share growth will be the mantra of bullish investors in a stock, whereas top line growth will the number offered by more pessimistic about the stock. Second, if you are using growth rates for companies from a data service, it is always worth asking questions about the approach used to compute growth (arithmetic or compounded) and time period used (starting and ending years), since they can skew growth rates up or down.

Growth Rates - A Global Overview
In keeping with the theme that with growth rates, it behooves us to be transparent about estimation choices, I will start by explaining my choices when it comes to growth. For historical growth rates, computed at the start of 2020, I use the compounded average growth rate in the previous five financial years. For most firms in my sample, this is the geometric average growth rate from 2014, as the base year, to 2019, as the final year in the sample. I will also compute growth rates in revenues (top line) and net income (the proverbial bottom line). With the latter, there will no growth rates computed for companies that are money losing, since the growth rate becomes a meaningless number. With that lead-in, I start by estimating growth rates by industry group, and in the table below, I list the ten industries with the highest growth rate in revenues in the last 5 years (2014-19) and the ten with the lowest:
Download spreadsheet
Note that even before the crisis, oil companies were shrinking, computers/peripherals had close to flat sales, and software dominates the list of high growth businesses. For a full list of growth rates, by industry, please click here.  To see if there are differences in growth in different parts of the world, I then break down growth rates in revenues and net income, by region, between 2014 and 2019.
Download spreadsheet
Note that more than a quarter of all publicly traded firms saw revenues shrink, in US dollar terms, over the last five years, and that across all firms, the median growth rate in net income is much higher than the median growth rate in revenues, across all regions. However, the range on net income growth is wider than the range on revenue growth. Finally, it is worth noting that investing is based upon future growth, not past growth, and I use estimates of expected growth rate in earnings per share as my proxy. Notwithstanding the biases that analysts bring into this estimation process, it remains a forward-looking number, and I look at how expected growth in earnings per share varies across companies in different PE ratio classes:

While this data is too raw to draw big conclusions from, higher PE stocks have, not surprisingly, have higher expected growth rates than low PE stocks. As investors, though, that tells you little about whether high PE stocks are good, bad or neutral investments, since the enduring question becomes whether (a) the high expected growth reflects reality or hopeful thinking on the part of analysts and (b) the PE ratio fully, under or over reflects this expected growth rate. It is one reason that I remain wary of using pricing screens to pick stocks, since there is no short cut or formula, that will answer this question. That will require a deep dive into the company's business model and full forecasting of earnings, cash flows and risk, i.e., an intrinsic valuation.

Profitability
Growth is only one part of the valuation puzzle, since without profits that come with it, it will be wasted. In this section, I will look at profitability across regions, sectors and subsets of stocks, again with the intent of eking out lessons that I can  to in corporate finance, investing and valuation. 

Margin Definitions & Usage
With profit margins, you scale profits to revenues, and as with growth, there are multiple metrics that can be used to compute margins, and which one is used is often a reflection of the biases that investors bring to the game. In the picture below, I look at a list of possible profit margins, and what each one is trying to measure:


By itself, each margin serves a purpose and tells a tale, and is worth calculating. Thus, the contribution margin measures the pure profits that you generate with every marginal unit you sell, since it nets out only the variable cost associated with producing that unit, giving many software companies close to 100% contribution margins. Gross margins are a close relative, providing a direct measure of marginal profitability and an indirect measure of how revenue increases flow into profits. To illustrate, Zoom, one of the few stocks that has seen its value increase during the crisis, reported a gross margin of 92% in 2019. Operating margins measure what is left after the other operating expenses of the company, which cannot be directly traced to individual unit sales, but are nevertheless necessary for its operations. Thus, R&D expenses and SG&A costs are netted out from gross profit to get to operating profit, yielding a measure that will capture economies of scale, as the company scales up. Netting out taxes and interest expenses, and adding back income from cash and cross holdings, yields net margin, a measure of what equity investors get to keep out of every dollar of revenues. It is a mixed and noisy measure, reflecting a company's operating model, its tax liabilities and its financial leverage (since debt creates interest expenses and affects taxes), as well as non-operating assets. Along the way, there are diversions. If you take the operating income, act like you have no debt and net the taxes you would have paid on that operating income, you get after-tax operating margin, a measure of operating profitability that takes into account taxes. If you take operating income, and add back depreciation and amortization, you get EBITDA margin, a measure of operating cash flows, before reinvestment. In recent year, companies with large stock based employee compensation have taken the tack that since it is in the form of shares or options, it is not an expense, and have added back this and other "extraordinary" expenses (with lots of leeway on what comprises extraordinary) to compute adjusted EBITDA margins that supposedly capture even better the cash flows at the firm. 

As you look at margins, whether reported by a company or computed by a third party (including me), here are some general principles to keep in mind. First, desperation drives a money-losing company up the income statement to use more expansive forms of margin. Notice that Microsoft, which has operating margins of close to 35% and net margins of 20% plus, never talks about gross margins, whereas some of Tesla's biggest promoters keep bring up the fact that its gross margin is 25%. Boasting that your gross margin is positive is akin to being on a diet and claiming that you consume only 1800 calories a day, but that is before you count the calories in the second courses at meals, desserts and snacks. Second, not all adjustments are created equal. I have long argued that while adding back depreciation and amortization to get to an EBITDA margin may be justifiable, adding back stock based compensation is not, since it is effectively using a barter system to evade cash flows. Put differently, you could have issued those restricted shares or options in the market, and used the cash to pay your employees, and chose not to.

Margins: A Global Overview
As with growth rates, I am going to begin by offering some background on the data that I use to compute my margins, and the adjustments that I make along the way. I use the revenues and income numbers from the trailing 12 months, which at the start of 2020, would give me the financials for most firms from October 2018 to September 2019. While that may seem short sighted, I have the archived numbers from the last decade on my website, for you to download and make your own judgments. Of course, with the market crisis fully upon us and a recession looming, you will be well served looking at the historical data. I start looking at margins across industries, to get a rough measure of how revenues flow through as earnings to the firm and its equity investors. In the table below, I list the ten industry groups with the highest and lowest operating margins, using global companies:
Download spreadsheet
Note that retail is particularly exposed in this crisis, simply because margins were low to begin with, though the question of how much will vary across retail. Thus, grocery and online retail may be more resilient than automotive and general retail from a prolonged shut down of commerce. Among the highest margin businesses, there are many that will see margins deteriorate very quickly from this crisis, with energy (both oil and green) showing the biggest near term hits. Real estate will also be exposed if there is a deep recession, but software, beverages and tobacco should see profitability hold up better. Looking across regions, I compute profitability measures across all companies in each region, recognizing that the industries that dominate each region be very different. 
Download spreadsheet
Note that the Asia had the lowest margins in 2019, a warning that high growth does not always translate into profitability. Conversely, Eastern European & Russian companies have high margins, albeit with low growth. African and Middle Eastern companies have sky high margins, reflecting domestic companies that dominate local markets with little competition.

Reinvestment Efficiency
If revenue growth captures the scaling up factor, and margins the profitability of a business, the last part of the story has to be about the efficiency with which the growth is delivered. For manufacturing companies, this will be captured in how much they spend in adding production capacity, and how efficiently they use this added capacity to produce more units. For non-manufacturing companies, the investment may be in research and development, acquisitions and other "intangibles", but it too is reinvestment and its payoff in growth affects value. For retail firms, it may take the form of inventory, accounts receivable and other ingredients of working capital, and how well they can manage these as they grow.

Reinvestment Efficiency:  Definitions & Usage
Unlike revenue growth and margins, which has widely accepted proxies and measures, reinvestment efficiency remains more of a smorgasbord of different measures. Broadly speaking, these measures scale how much capital is invested either to the operating income that is created, in returns on capital measures, or to revenues, by relating capital invested to revenue growth.

In sum, reinvestment in any period is defined broadly to include not just investments in plant and capacity, the accountant's traditional cap ex measure, but also working capital, acquisitions and investments in research and development and intangible assets.
Reinvestment = (Cap Ex - Depreciation & Amortization) + Change in non-cash Working Capital + Acquisitions + (R&D expenses - Amortization of R&D)
That reinvestment accumulated over time comprises the invested capital of the firm, and both numbers (reinvestment and invested capital) can be scaled to either after-tax operating income or to revenues. When margins are stable, the two approaches are equivalent, but when the margins are changing, the revenue-scaled measures become more useful.

Reinvestment Measures: A Global Overview
 I noted at the start of this post that "ease of scaling up" has become a central theme of young growth companies reaching into new and often very large markets. While this has always been a selling point for conventional software and technology firms, it has expanded its reach into other businesses, from Uber in car service/logistics to Casper in mattress sales. In essence, the selling point for these models is that they can reinvest much more efficiently than their established competitors, though their growth pitch is still more focused on sales than on profits. In this section, I report on investment efficiency numbers, staying true to my premise that reinvestment has to include acquisitions and R&D. To get a sense of how investment efficiency varies across industries, I computed sales to invested capital and returns on capital, across industry groups, and in the table below, I report on the ten most and ten least efficient industries, at least when it comes to delivering revenues for every dollar of capital invested. 
Looking at regional differences, again recognizing that the industry concentrations vary geographically, I find the following:
Download spreadsheet
Note that the concentration of natural resource companies in Australia, New Zealand and Canada, which lowered profitability, is also showing up as lower returns on capital. The more troubling number is the 4.55% median return on capital delivered by the median global company in 2019, not only well below the cost of capital globally, but also likely to see a major hit this year, as  the Corona Virus works through the global economy.

Excess Returns
I talked about risk and hurdle rates in my four earlier data posts, where I started with the price of risk in markets (equity risk premiums and default spreads) and then about relative risk measures. In this last section, I will bring together the return measures discussed in the last section with the hurdle rates estimated in prior posts to create composite measures of excess returns, as measures of value creation.

Excess Returns Definitions and Usage
While businesses that make money are viewed as successful, that is a low hurdle for success. After all, capital is invested in businesses and that capital invested elsewhere, in equivalent risk investments, could have earned a return. That return is what we were trying to estimate, with all of its complications, in my previous updates on risk free rates, equity risk premiums and relative risk measures.

These comparisons, which are at first sight simple, are complicated by how well we can measure how much capital is invested in a project or existing assets and how closely the accounting earnings capture true earnings. Adding to the measurement issues is the fact that earnings are volatile and using a single year's number can skew our conclusions.

Excess Returns: A Global Overview
With the caveat in mind that the returns on capital that I compute for individual companies reflects operating income in 2019, a potential problem given that it is just one year and a number that clearly will change (and fairly dramatically so) because of the virus, I compared the return on capital to the cost of capital for each of the 39,000 non-financial service companies in my sample and used that comparison to create a global distribution of excess returns: 


The story here is a depressing one, at least for this comparison, as 54% of global companies generated returns on capital that were lower than their costs of capital by 2% or more, and 32% of global companies earned returns that exceeded their costs of capital by 2% or more; 14% of companies earned returns that were within 2% of their costs of capital. The only part of the world where more companies earned more than their cost of capital than earned less was Japan, and even there, there are questions about whether this is an artifact of Japanese accounting practices rather than a sign of value creation. To complete the assessment, I looked at excess returns generated, by industry, and created a listing of the five industry groups with the most positive and the five with most negative median excess returns:
Download spreadsheet
You may be surprised to see biotechnology and healthcare IT at the top of the list of negative excess return businesses, but given that many of the companies in these industries are still  young, money-losing firms with promising products in the pipeline, this may be more a reflection of the limitations of using return on capital with young companies, than a true measure of excess returns. The presence of mining and oil/gas on the list is more troubling, since it suggests that even before the brutal shocks meted out in markets in the last few weeks, these sectors were struggling. It should be no surprise that the businesses that have the highest excess returns are mostly service companies, with low capital intensity, with the exception of tobacco, a high-margin business that also has the benefit of providing a non-discretionary product.

Wrapping up
Heading into a post-virus economy, where there will be wrenching changes in most sectors, you may wonder why I even bother looking at the profitability and excess returns from 2019. After all, every one of the numbers reported in this post will be dated, as companies update their financials to reflect the damage done. That said, I think it still makes sense to look at growth, profitability and reinvesting, pre-crisis, to get a sense of how much punishment companies can take. In businesses that already had anemic revenue growth, low margins and poor investment efficiency, the effects of the crisis will be far more devastating than in businesses with higher growth, margins and efficient investment. There is a reason why airlines, retail and oil are in the front lines of this war, suffering the most casualties, and why technology and heath care are doing better.

YouTube Video


Data
1. Growth, Profit Margins, Reinvestment Efficiency and Excess Returns, by Region: 2020
2. Growth, Profit Margins, Reinvestment Efficiency and Excess Returns, by Industry: 2020


Sunday, January 27, 2019

January 2019 Data Update 6: Profitability and Value Creation!

In my last post, I looked at hurdle rates for companies, across industries and across regions, and argued that these hurdle rates represent benchmarks that companies have to beat, to create value. That said, many companies measure success using lower thresholds, with some arguing that making money (having positive profits) is good enough and others positing that being more profitable than competitors in the same business makes you a good company. In this post, I will look at all three measures of success, starting with the minimal (making money), moving on to relative judgments (and how best to compare profitability across companies of different scales) and ending with the most rigorous one of whether the profits are sufficient to create value.

Measuring Financial Success
You may start a business with the intent of meeting a customer need or a societal shortfall but your financial success will ultimately determine your longevity. Put bluntly, a socially responsible company with an incredible product may reap good press and have case studies written about it, but if it cannot establish a pathway to profitability, it will not survive. But how do you measure financial success? In this portion of the post, I will start with the simplest measure of financial viability, which is whether the company is making money, usually from an accounting perspective, then move the goal posts to see if the company is more or less profitable than its competitors, and end with the toughest test, which is whether it is generating enough profits on the capital invested in it, to be a value creator.

Profit Measures
Before I present multiple measures of profitability, it is useful to step back and think about how profits should be measured. I will use the financial balance sheet construct that I used in my last post to explain how you can choose the measure of profitability that is right for your analysis:

Just as hurdle rates can vary, depending on whether you take the perspective of equity investors (cost of equity) or the entire business (cost of capital), the profit measures that you use will also be different, depending on perspective. If looked at through the eyes of equity investors, profits should be measured after all other claim holders (like debt) and have been paid their dues (interest expenses), whereas using the perspective of the entire firm, profits should be estimated prior to debt payments. In the table below, I have highlighted the various measures of profits and cash flows, depending on claim holder perspective:
The key, no matter which claim holder perspective you adopt, is to stay internally consistent. Thus, you can discount cash flows to equity (firm) at the cost of equity (capital) or compare the return on equity (capital) to the cost of equity (capital), but you cannot mix and match.

The Minimal Test: Making money?
The lowest threshold for success in business is to generate positive profits, perhaps the reason why accountants create measures like breakeven, to determine when that will happen. In my post on measuring risk, I looked at the percentages of firms that meet this threshold on net income (for equity claim holders), an operating income (for all claim holders) and EBITDA (a very rough measure of operating cash flow for all claim holders). Using that statistic for the income over the last twelve month, a significant percentage of publicly traded firms are profitable:
Data, by country
The push back, even on this simplistic measure, is that just as one swallow does not a summer make, one year of profitability is not a measure of continuing profitability. Thus, you could expand this measure to not just look at average income over a longer period (say 5 to 10 years) and even add criteria to measure sustained profitability (number of consecutive profitable years). No matter which approach you use, you still will have two problems. The first is that because this measure is either on (profitable) or off (money losing), it cannot be used to rank or grade firms, once they have become profitable. The other is that making money is only the first step towards establishing viability, since the capital invested in the firm could have been invested elsewhere and made more money. It is absurd to argue that a company with $10 billion in capital invested in it is successful if it generates $100 in profits, since that capital invested even in treasury bills could have generated vastly more money.

The Relative Test: Scaled Profitability
Once a company starts making money, it is obvious that higher profits are better than  lower ones, but unless these profits are scaled to the size of the firm, comparing dollar profits will bias you towards larger firms. The simplest scaling measure is revenues, a data item available for all but financial service firms, and one that is least likely to be affected by accounting choices, and profits scaled to revenues yields profit margins. In a data update post from a year ago, I provided a picture of different margin measures and why they might provide different information about business profitability:

As I noted in my section on claimholders above, you would use net margins to measure profitability to equity investors and operating margins (before or after taxes) to measure profitability to the entire firm. Gross and EBITDA margins are intermediate stops that can be used to assess other aspects of profitability, with gross margins measuring profitability after production costs (but before selling and G&A costs) and EBITDA margins providing a crude measure of operating cash flows.

In the graph below, I look at the distribution of pre-tax operating margins and net margins globally, and provide regional medians for the margin measures:

The regional comparisons of margins are difficult to analyze because they reflect the fact that different industries dominate different regions, and margins vary across industries. You can get the different margin measures broken down by industry, in January 2019, for US firms by clicking here. You can download the regional averages using the links at the end of this post.

The Value Test: Beating the Hurdle Rate
As a business, making money is easier than creating value, since to create value, you have to not just make money, but more money than you could have if you had invested your capital elsewhere. This innocuous statement lies at the heart of value, and it is in fleshing out the details that we run into practical problems on the three components that go into it:
  1. Profits: The profit measures we have for companies reflect their past, not the future, and even the past measures vary over time, and for different proxies for profitability. You could look at net income in the most recent twelve months or average net income over the last ten years, and you  could do the same with operating income. Since value is driven by expectations of future profits, it remains an open question whether any of these past measures are good predictors.
  2. Invested Capital: You would think that a company would keep a running tab of all the money that is invested in its projects/assets, and in a sense, that is what the book value is supposed to do. However, since this capital gets invested over time, the question of how to adjust capital invested for inflation has remained a thorny one. If you add to that the reality that the invested capital will change as companies take restructuring charges or buy back stock, and that not all capital expenses finds their way on to the balance sheet, the book value of capital may no longer be a good measure of capital invested in existing investments.
  3. Opportunity Cost: Since I spent my last post entirely on this question, I will not belabor the estimation challenges that you face in estimating a hurdle rate for a company that is reflective of the risk of its investments.
In a perfect world, you would scale your expected cashflows in future years, adjusted for time value of money, to the correct amount of capital invested in the business and compare it to a hurdle rate that reflects both your claim holder choice (equity or the business) but also the risk of the business. In fact, that is exactly what you are trying to do in a good intrinsic or DCF valuation. 

Since it is impossible to do this for 42000 plus companies, on a company-by-company basis, I used blunt instrument measures of each component, measuring profits with last year's operating income after taxes, using book value of capital (book value of debt + book value of equity - cash) as invested capital:

Similarly, to estimate cost of capital, I used short cuts I would not use, if I were called up to analyze a single company: 


Comparing the return on capital to the cost of capital allows me to estimate excess returns for each of my firms, as the difference between the return on invested capital and the cost of capital. The distribution of this excess return measure globally is in the graph below:
I am aware of the limitations of this comparison. First, I am using the trailing twelve month operating income as profits, and it is possible that some of the firms that measure up well and badly just had a really good (bad) year. It is also biased against young and growing firms, where future income will be much higher than the trailing 12-month value. Second, operating income is an accounting measure, and are affected not just by accounting choices, but are also affected by the accounting mis-categorization of lease and R&D expenses. Third, using book value of capital as a proxy for invested capital can be undercut by not only whether accounting capitalizes expenses correctly but also by well motivated attempts by accountants to write off past mistakes (which create charges that lower invested capital and make return on capital look better than it should). In fact, the litany of corrections that have to be made to return on capital to make it usable and listed in this long and very boring paper of mine. Notwithstanding these critiques, the numbers in this graph tell a depressing story, and one that investors should keep in mind, before they fall for the siren song of growth and still more growth that so many corporate management teams sing. Globally, approximately 60% of all firms globally earn less than their cost of capital, about 12% earn roughly their cost of capital and only 28% earn more than their cost of capital. There is no region of the world that is immune from this problem, with value destroyers outnumbering value creators in every region.

Implications
From a corporate finance perspective, there are lessons to be learned from the cross section of excess returns, and here are two immediate ones:
  1. Growth is a mixed blessing: In 60% of companies, it looks like it destroys value, does not add to it. While that proportion may be inflated by the presence of bad years or companies that are early in the life cycle, I am sure that the proportion of companies where value is being destroyed, when new investments are made, is higher than those where value is created.
  2. Value destruction is more the rule than the exception: There are lots of bad companies, if bad is defined as not making your hurdle rate. In some companies, it can be attributed to bad managed that is entrenched and set in its ways. In others, it is because the businesses these companies are in have become bad business, where no matter what management tries, it will be impossible to eke out excess returns.
You can see the variations in excess returns across industries, for US companies, by clicking on this link, but there are clearly lots of bad businesses to be in. The same data is available for other regions in the datasets that are linked at the end of this post.

If there is a consolation prize for investors in this graph, it is that the returns you make on your investment in a company are driven by a different dynamic. If stocks are value driven, the stock price for a company will reflect its investment choices, and companies that invest their money badly will be priced lower than companies that invest their money well. The returns you will make on these companies, though, will depend upon whether the excess returns that they deliver in the future are greater or lower than expectations. Thus, a company that earns a return on capital of 5%, much lower than its cost of capital of 10%, which is priced to continue earning the same return will see if its stock price increase, if it can improve its return on capital to 7%, still lower than the cost of capital, but higher than expected. By the same token, a company that earns a return on capital of 25%, well above its cost of capital of 10%, and priced on the assumption that it can continue on its value generating path, will see its stock price drop, if the returns it generates on capital drop to 20%, well above the cost of capital, but still below expectations. That may explain a graph like the following, where researchers found that investing in bad (unexcellent) companies generated far better returns than investing in good (excellent) companies:
Original Paper: Excellence Revisited, by Michelle Klayman
The paper is dated, but its results are not, and they have been reproduced using other categorizations for good and bad firms. Thus, investing in the most admired firms generates worse returns for investors than investing in the least admired and investing in popular (with investors) firms under performs investing in unpopular ones. While these results may seem perverse, at first sight, that bad (good) companies can be good (bad) investments, it makes sense, once you factor in the expectations game

Finally, on the corporate governance front, I feel that we have lost our way. Corporate governance laws and measures have focused on check boxes on director independence and corporate rules, rather than furthering the end game of better managed companies. From my perspective, corporate governance should give stockholders a chance to change the way companies are run, and if corporate governance works well, you should see more management turnover at companies that don't earn what they need to on capital. The fact that six in ten companies across the globe earned well below their cost of capital in 2018, added to the reality that many of these companies have not only been under performing for years, but are still run by the same management, makes me wonder whether the push towards better corporate governance is more talk than action.

YouTube Video


Data Links
  1. Profit Margins: USGlobalEmerging MarketsEuropeJapanIndiaChinaAus & Canada
  2. Excess Returns to Equity and Capital: USGlobalEmerging MarketsEuropeJapanIndiaChinaAus & Canada