Early/Mid 2012 statewide opinion polling for the 2012 United States presidential election

Last updated

Statewide polls for the 2012 United States presidential election are as follows. The polls listed here, by state, are from January 1 to August 31, 2012, and provide early data on opinion polling between a possible Republican candidate against incumbent President Barack Obama.

Contents

Note that some states had not conducted polling yet or no updated polls were present from January 1 to August 31, 2012.

Obama vs. Romney Leading presidential candidate 2012 by state Obama Romney.svg
Obama vs. Romney
Obama vs. Gingrich Leading presidential candidate 2012 by state Obama Gingrich.svg
Obama vs. Gingrich
Obama vs. Santorum Leading presidential candidate 2012 by state Obama Santorum.svg
Obama vs. Santorum
Obama vs. Paul Leading presidential candidate 2012 by state Obama Paul.svg
Obama vs. Paul

Alabama

9 electoral votes
(Republican in 2004) 62%–38%
(Republican in 2008) 60%–38%

Poll sourceDate administeredDemocrat %Republican %Lead marginSample sizeMargin of error
Capital Survey Research Center [1] August 13–16, 2012Barack Obama36%Mitt Romney54%18452 RV±4.6%
Capital Survey Research Center [2] June 7, 18–19, 26–27, 2012Barack Obama36%Mitt Romney51%15551 LV±4.2%

Arizona

11 electoral votes
(Republican in 2004) 55%–44%
(Republican in 2008) 53%–45%

Poll sourceDate administeredDemocrat %Republican %Lead marginSample sizeMargin of error
Public Policy Polling [3] July 23–25, 2012Barack Obama41%Mitt Romney52%11833 RV±3.4%
Rasmussen Reports/Pulse Opinion Research [4] June 26, 2012Barack Obama41%Mitt Romney54%13500 LV±4.5%
Project New America/Public Policy Polling (D) [5] June 4–5, 2012Barack Obama46%Mitt Romney49%3791 RV±3.5%
Public Policy Polling [6] May 17–20, 2012Barack Obama43%Mitt Romney50%7500 RV±4.4%
DC London/Magellan Strategies (R) [7] April 30 – May 2, 2012Barack Obama43%Mitt Romney52%9909 LV±3.25%
Behavior Research Center (Rocky Mountain Poll [8] )April 9–17, 2012Barack Obama42%Mitt Romney40%2511 RV±4.4%
Arizona State University [9] April 8–14, 2012Barack Obama40%Mitt Romney42%2488 RV±4.4%
Rasmussen Reports/Pulse Opinion Research [4] March 13, 2012Barack Obama40%Mitt Romney51%11500 LV±4.5%
44% Rick Santorum 45%1
NBC News/Marist College [10] February 19–20, 2012Barack Obama40%Mitt Romney45%52,487 RV±1.8%
Barack Obama41% Ron Paul 43%2
Barack Obama45% Newt Gingrich 40%5
Barack Obama42%Rick Santorum45%3
Public Policy Polling [11] February 17–19, 2012Barack Obama47%Mitt Romney47%Tie743 RV±3.6%
Barack Obama46%Ron Paul42%4
Barack Obama48%Newt Gingrich44%4
Barack Obama46%Rick Santorum47%1
Behavior Research Center (Rocky Mountain Poll) [12] January 5–9, 2012Barack Obama37%Mitt Romney43%6553 RV±4.3%
Barack Obama44%Ron Paul36%8
45%Newt Gingrich35%10
43%Rick Santorum34%9

Three way race

Poll sourceDate administeredDemocrat %Republican % Libertarian  %Lead marginSample sizeMargin of error
Public Policy Polling [13] May 17–20, 2012 Barack Obama 41% Mitt Romney 45% Gary Johnson 9%4500 RV±4.4%

Arkansas

6 electoral votes
(Republican in 2004) 54%–45%
(Republican in 2008) 59%–39%

Poll sourceDate administeredDemocrat %Republican %Lead marginSample sizeMargin of error
Talk Business/Hendrix College [14] March 26, 2012 Barack Obama 33% Mitt Romney 56.5%23.5759 LV±3.6%

California

55 electoral votes
(Democratic in 2004) 54%–45%
(Democratic in 2008) 61%–37%

Poll sourceDate administeredDemocrat %Republican %Lead marginSample sizeMargin of error
Policy Analysis for California Education/USC Rossier School of Education/Tulchin Research [15] August 3–7, 2012Barack Obama55.6%Mitt Romney32.7%22.91,041 LV±3.0%
CBRT/Pepperdine University/M4 Strategies [16] July 16–17, 2012Barack Obama51.9%Mitt Romney32.6%19.3812 LV±3.4%
Field Research Corporation (Field Poll) [17] June 21 – July 2, 2012Barack Obama55%Mitt Romney37%18848 LV±3.4%
SurveyUSA [18] May 27–29, 2012Barack Obama57%Mitt Romney36%211,575 RV±2.5%
Field Research Corporation (Field Poll) [19] May 21–29, 2012Barack Obama48%Mitt Romney32%16710 RV±3.8%
USC Dornsife/Los Angeles Times/Greenberg Quinlan Rosner/American Viewpoint [20] May 17–21, 2012Barack Obama56%Mitt Romney37%191,002 RV±3.5%
Public Policy Institute of California [21] May 14–20, 2012Barack Obama50%Mitt Romney39%11894 LV±4.2%
SurveyUSA [22] March 29, 2012 – April 2, 2012Barack Obama62%Mitt Romney31%311,995 RV±2.2%
USC Dornsife/Los Angeles Times/Greenberg Quinlan Rosner/American Viewpoint [23] March 14–19, 2012Barack Obama57%Mitt Romney36%211,500 RV±2.9%
Field Research Corporation (Field Poll) [24] February 11–18, 2012Barack Obama55%Mitt Romney35%201,000 RV±3.1%
Rasmussen Reports/Pulse Opinion Research [25] February 8–16, 2012Barack Obama57%Mitt Romney35%22500±4.5%
58% Rick Santorum 30%28
SurveyUSA [26] February 8–9, 2012Barack Obama60%Mitt Romney31%292,088 RV±2.1%
63% Newt Gingrich 27%36
61% Ron Paul 29%31
61%Rick Santorum29%32

Colorado

9 electoral votes
(Republican in 2004) 52%–47%
(Democratic in 2008) 54%–45%

Poll sourceDate administeredDemocrat %Republican %Lead marginSample sizeMargin of error
Keating Research/OnSight Public Affairs [27] August 21–22, 2012Barack Obama48%Mitt Romney44%4500 LV±4.4%
Purple Strategies [28] August 13–14, 2012Barack Obama49%Mitt Romney46%3600 LV±4.0%
Rasmussen Reports/Pulse Opinion Research [29] August 6, 2012Barack Obama47%Mitt Romney47%Tied500 LV±4.5%
Public Policy Polling [30] August 2–5, 2012Barack Obama49%Mitt Romney43%6779 LV±3.5%
Purple Strategies [31] July 9–13, 2012Barack Obama45%Mitt Romney44%1600 LV±4.0%
Priorities USA Action/Garin-Hart-Yang-Research Group (D) [32] June 25 – July 5, 2012Barack Obama49%Mitt Romney42%7608 LV±4.%
We Ask America [33] June 25, 2012Barack Obama46.6%Mitt Romney43%3.61,083 LV±2.98%
Public Policy Polling [34] June 14–17, 2012Barack Obama49%Mitt Romney42%7799 LV±3.5%
Rasmussen Reports/Pulse Opinion Research [29] June 7, 2012Barack Obama45%Mitt Romney45%Tied500 LV±4.5%
Purple Strategies [35] May 31 – June 5, 2012Barack Obama48%Mitt Romney46%2600 LV±4.0%
NBC News/Marist College [36] May 22–24, 2012Barack Obama46%Mitt Romney45%11,030 RV±3.0%
Project New America/Keating Research/Keating Research/OnSight Public Affairs (D) [37] May 21–24, 2012Barack Obama48%Mitt Romney44%4601 RV±4.0%
Purple Strategies [38] April 19–23, 2012Barack Obama47%Mitt Romney47%TiedNot reported±4.1%
Public Policy Polling [39] April 5–7, 2012Barack Obama53%Mitt Romney40%13542±4.2%
55% Newt Gingrich 37%18
54% Rick Santorum 38%16
47% Ron Paul 42%5

Three way race

Poll sourceDate administeredDemocrat %Republican % Libertarian  %Lead marginSample sizeMargin of error
Public Policy Polling [30] August 2–5, 2012Barack Obama46%Mitt Romney42%Gary Johnson4%4779±3.5%
Public Policy Polling [34] June 14–17, 2012Barack Obama47%Mitt Romney39%Gary Johnson7%8799±3.5%

Connecticut

7 electoral votes
(Democratic in 2004) 54%–44%
(Democratic in 2008) 61%–38%

Poll sourceDate administeredDemocrat %Republican %Lead marginSample sizeMargin of error
Quinnipiac University [40] August 22–26, 2012Barack Obama52%Mitt Romney45%71,472 LV±2.6%
Rasmussen Reports/Pulse Opinion Research [41] August 21, 2012Barack Obama51%Mitt Romney43%8500 LV±4.5%
Quinnipiac University [42] May 29, 2012 – June 3, 2012Barack Obama50%Mitt Romney38%121,408±2.6%
Quinnipiac University [43] March 14–19, 2012Barack Obama53%Mitt Romney37%161,622±2.4%
55% Rick Santorum 35%20

Florida

29 electoral votes
(Republican in 2004) 52%–47%
(Democratic in 2008) 51%–48%

Poll sourceDate administeredDemocrat %Republican %Lead marginSample sizeMargin of error
CNN/Time/Opinion Research Corporation [44] August 22–26, 2012Barack Obama50%Mitt Romney46%4776 LV±3.5%
CBS News/New York Times/Quinnipiac University [45] August 15–21, 2012Barack Obama49%Mitt Romney46%31,241 LV±2.8%
Gravis Marketing [46] August 20, 2012Barack Obama45%Mitt Romney48%3728 LV±3.8%
Foster McCollum White Baydoun/Douglas Fulmer & Associates [47] August 17, 2012Barack Obama39.9%Mitt Romney54.46%14.561,503 LV±2.53%
Rasmussen Reports/Pulse Opinion Research [48] August 15, 2012Barack Obama43%Mitt Romney45%2500 LV±4.5%
Purple Strategies [28] August 13–14, 2012Barack Obama47%Mitt Romney48%1600 LV±4.0%
CBS News/New York Times/Quinnipiac University [49] July 24–30, 2012Barack Obama51%Mitt Romney45%61,177 LV±3.0%
Public Policy Polling [50] July 26–29, 2012Barack Obama48%Mitt Romney47%1871 LV±3.3%
WFLA-TV Tampa/SurveyUSA [51] July 17–19, 2012Barack Obama48%Mitt Romney43%5647 LV±3.9%
Purple Strategies [52] July 9–13, 2012Barack Obama45%Mitt Romney48%3600 LV±4.0%
Mason-Dixon Polling & Research [53] July 9–11, 2012Barack Obama46%Mitt Romney45%1800 RV±3.5%
Rasmussen Reports/Pulse Opinion Research [48] July 9, 2012Barack Obama45%Mitt Romney46%1500 LV±4.5%
Priorities USA/Garin-Hart-Yang Research Group (D) [32] June 25 – July 3, 2012Barack Obama48%Mitt Romney44%4608 LV±4.0%
We Ask America [54] July 1–2, 2012Barack Obama46.1%Mitt Romney45.3%0.81,127 LV±2.9%
Quinnipiac University [55] June 19–25, 2012Barack Obama45%Mitt Romney41%41,200 RV±2.8%
Quinnipiac University [56] June 12–18, 2012Barack Obama46%Mitt Romney42%41,697 RV±2.4%
Purple Strategies [57] May 31, 2012 – June 5, 2012Barack Obama45%Mitt Romney49%4600 LV±4.0%
Public Policy Polling [58] May 31 – June 3, 2012Barack Obama50%Mitt Romney46%4642 RV±3.9%
Quinnipiac University [59] May 15–21, 2012Barack Obama41%Mitt Romney47%61,722 RV±2.4%
NBC News/Marist College [60] May 17–20, 2012Barack Obama48%Mitt Romney44%41,078 RV±3.0%
Suffolk University/7News [61] May 6–8, 2012Barack Obama46%Mitt Romney45%1600 RV±4%
Quinnipiac University [62] April 25 – May 1, 2012Barack Obama43%Mitt Romney44%11,169 RV±2.9%
Rasmussen Reports/Pulse Opinion Research [48] April 25, 2012Barack Obama45%Mitt Romney46%1500 LV±4.5%
Purple Strategies [63] April 19–23, 2012Barack Obama45%Mitt Romney47%2600 LV±4.1%
Fox News/Anderson Robbins/Shaw & Company [64] April 15–17, 2012Barack Obama45%Mitt Romney43%2757 RV±4.0%
Public Policy Polling [65] April 12–15, 2012Barack Obama52% Newt Gingrich 40%8700 LV±3.7%
50% Ron Paul 40%10
50%Mitt Romney45%5
Quinnipiac University [66] March 20–26, 2012Barack Obama49%Mitt Romney42%71,228 RV±2.8%
50% Rick Santorum 37%13
Rasmussen Reports/Pulse Opinion Research [48] March 13, 2012Barack Obama46%Mitt Romney43%3500 LV±4.5%
45%Rick Santorum43%2
Rasmussen Reports/Pulse Opinion Research [48] February 9, 2012Barack Obama47%Mitt Romney44%3500 LV±4.5%
47%Rick Santorum46%1
NBC News/Marist College [67] January 25–27, 2012Barack Obama49%Mitt Romney41%81,739 LV±2.7%
52%Newt Gingrich35%17
50%Ron Paul36%14
50%Rick Santorum35%15
Mason-Dixon Research & Polling/Miami Herald/El Nuevo Herald [68] January 24–26, 2012Barack Obama44%Mitt Romney48%4800 LV±3.5%
Barack Obama50%Newt Gingrich41%9
50%Rick Santorum39%11
Suffolk University [69] January 22–24, 2012Barack Obama42%Mitt Romney47%5600 RVNot reported
Barack Obama49%Newt Gingrich40%9
Quinnipiac University [70] January 19–23, 2012Barack Obama45%Mitt Romney45%Tied1,518 RV±2.5%
Barack Obama50%Newt Gingrich39%11
47%Ron Paul39%8
49%Rick Santorum40%9
Everglades Foundation/Tarrance Group (R) [71] January 4–8, 2012Barack Obama46%Mitt Romney45%1607 LV±4.1%
Quinnipiac University [72] January 4–8, 2012Barack Obama43%Mitt Romney46%31,412 RV±2.8%
Barack Obama45%Rick Santorum43%2

Three way race

Poll sourceDate administeredDemocrat %Republican % Libertarian  %Lead marginSample sizeMargin of error
Mason Dixon [53] July 9–11, 2012 Barack Obama 46% Mitt Romney 45% Gary Johnson 2%1800±3.5%

Georgia

16 electoral votes
(Republican in 2004) 58%–41%
(Republican in 2008) 52%–47%

Poll sourceDate administeredDemocrat %Republican %Lead marginSample sizeMargin of error
20/20 Insight [73] August 15–18, 2012Barack Obama46%Mitt Romney49%31,158 LV±2.9%
Majority Opinion Research/InsiderAdvantage [74] May 22, 2012Barack Obama40%Mitt Romney52%12438Not reported
Rosetta Stone Communications/Landmark Communications [75] May 10, 2012Barack Obama40.2%Mitt Romney51.1%10.9600 RV±4.0%
SurveyUSA [76] February 23–26, 2012Barack Obama44% Newt Gingrich 48%41,156 RV±2.9%
42%Mitt Romney49%7
43% Rick Santorum 47%4
43% Ron Paul 46%3

Illinois

20 electoral votes
(Democratic in 2004) 55%–45%
(Democratic in 2008) 62%–37%

Poll sourceDate administeredDemocrat %Republican %Lead marginSample sizeMargin of error
Crain's Chicago Business/Ipsos [77] July 16–22, 2012Barack Obama51%Mitt Romney31%20600±4.7%
WGN-TV/Chicago Tribune [78] February 2–6, 2012Barack Obama56%Mitt Romney35%21600±4.0%

Indiana

11 electoral votes
(Republican in 2004) 60%–39%
(Democratic in 2008) 50%–49%

Poll sourceDate administeredDemocrat %Republican %Lead marginSample sizeMargin of error
Rasmussen Reports/Pulse Opinion Research [79] July 31 – August 1, 2012Barack Obama35%Mitt Romney51%16400 LV±5.0%
Rasmussen Reports/Pulse Opinion Research [79] May 25, 2012Barack Obama42%Mitt Romney48%6600 LV±4.0%
Howey Politics/DePauw University/Bellwether Research/Garin-Hart-Yang Research Group [80] March 26–27, 2012Barack Obama40%Mitt Romney49%9503 LV±4.5%
41% Rick Santorum 46%5

Iowa

6 electoral votes
(Republican in 2004) 50%–49%
(Democratic in 2008) 54%–44%

Poll sourceDate administeredDemocrat %Republican %Lead marginSample sizeMargin of error
Public Policy Polling [81] August 23–26, 2012Barack Obama47%Mitt Romney45%21,244 LV±2.8%
Rasmussen Reports/Pulse Opinion Research [82] August 8, 2012Barack Obama44%Mitt Romney46%2500 LV±4.5%
Public Policy Polling [83] July 12–15, 2012Barack Obama48%Mitt Romney43%51,131 RV±2.91%
We Ask America [84] June 18, 2012Barack Obama45%Mitt Romney44%11,086 LV±3.0%
Rasmussen Reports/Pulse Opinion Research [82] June 11, 2012Barack Obama46%Mitt Romney47%1500 LV±4.5%
NBC News/Marist College [85] May 22–24, 2012Barack Obama44%Mitt Romney44%Tied1,106 RV±3.0%
Public Policy Polling [86] May 3–6, 2012Barack Obama47% Ron Paul 39%81,181 RV±2.85%
Barack Obama51% Mitt Romney 41%10
Des Moines Register/Selzer & Co. [87] February 12–15, 2012Barack Obama51% Newt Gingrich 37%14611 LV±3.5%
Barack Obama44%Mitt Romney46%2
42%Ron Paul49%7
44% Rick Santorum 48%4

Maine

4 electoral votes
(Democratic in 2004) 53%–45%
(Democratic in 2008) 58%–40%

Poll sourceDate administeredDemocrat %Republican %Lead marginSample sizeMargin of error
Portland Press Herald/Critical Insights [88] June 20–25, 2012Barack Obama49%Mitt Romney35%14615 RV±4.0%
MassINC Polling Group [89] June 13–14, 2012Barack Obama48%Mitt Romney34%14506 LV±4.4%
Critical Insights [90] May 2–7, 2012Barack Obama50%Mitt Romney42%8600 RV±4.0%
Public Policy Polling [91] March 2–4, 2012Barack Obama54% Ron Paul 38%161,256 RV±2.8%
58% Rick Santorum 35%23
60% Newt Gingrich 32%28
58% Mitt Romney 35%23

Maryland

10 electoral votes
(Democratic in 2004) 56%–43%
(Democratic in 2008) 61%–38%

Poll sourceDate administeredDemocrat %Republican %Lead marginSample sizeMargin of error
Marylanders for Marriage Equality/Public Policy Polling (D) [92] May 14–16, 2012Barack Obama58%Mitt Romney35%23852 LV±3.4%

Massachusetts

11 electoral votes
(Democratic in 2004) 62%–37%
(Democratic in 2008) 62%–36%

Poll sourceDate administeredDemocrat %Republican %Lead marginSample sizeMargin of error
Kimball Political Consulting [93] August 21, 2012Barack Obama52%Mitt Romney41%11592 LV±4%
Public Policy Polling [94] August 16–19, 2012Barack Obama55%Mitt Romney39%161,115LV±2.9%
Public Policy Polling [95] June 22–24, 2012Barack Obama55%Mitt Romney39%16902LV±3.3%
Western New England University [96] May 29–31, 2012Barack Obama56%Mitt Romney34%22504 LV±4.4%
The Boston Globe/University of New Hampshire [97] May 25–31, 2012Barack Obama46%Mitt Romney34%12651 LV±3.8%
Suffolk University [98] May 20–22, 2012Barack Obama59%Mitt Romney34%25600 LV±4%
Rasmussen Reports/Pulse Opinion Research [99] May 7, 2012Barack Obama56%Mitt Romney35%21500 LV±4.5%
Rasmussen Reports/Pulse Opinion Research [99] April 9, 2012Barack Obama51%Mitt Romney40%11500 LV±4.5%
The Boston Globe/University of New Hampshire [100] March 21–27, 2012Barack Obama49%Mitt Romney33%16544 LV±4.4%
Public Policy Polling [101] March 16–18, 2012Barack Obama62% Newt Gingrich 28%34936 RV±3.2%
58% Ron Paul 30%28
58%Mitt Romney35%23
61% Rick Santorum 29%32
MassLive.com/The Republican/Western New England University [102] February 23 – March 1, 2012Barack Obama60%Mitt Romney34%26527 RV±4.3%
Rasmussen Reports/Pulse Opinion Research [99] February 29, 2012Barack Obama55%Mitt Romney38%17500 LV±4.5%
58%Rick Santorum32%26
Suffolk University [103] February 11–15, 2012Barack Obama63%Newt Gingrich27%36600 LV±4.0%
53%Mitt Romney39%14
59%Rick Santorum32%27
60%Ron Paul26%34
Mass Insight Global Partnerships/Opinion Dynamics Corporation [104] January 31 – February 4, 2012Barack Obama56%Mitt Romney38%18456 RV±4.6%

Four Way race

Poll sourceDate administeredDemocrat %Republican %Green %Libertarian %Lead margin
Public Policy Polling [95]
Margin of error: ±3.3%
Sample size: 902LV
June 22–24, 2012 Barack Obama 53% Mitt Romney 38% Jill Stein 3% Gary Johnson 1%15

Michigan

16 electoral votes
(Democratic in 2004) 51%–48%
(Democratic in 2008) 57%–41%

Poll sourceDate administeredDemocrat %Republican %Lead marginSample sizeMargin of error
EPIC-MRA [105] August 28, 2012Barack Obama49%Mitt Romney46%31200 LV±2.6%
Mitchell Research & Communications [106] August 23, 2012Barack Obama46.6%Mitt Romney47.7%0.11277 LV±2.74%
Detroit News/Glengariff Group [107] August 18–20, 2012Barack Obama47.5%Mitt Romney42.0%5.5600 LV±4.0%
Foster McCollum White & Associates/Baydoun Consulting [108] August 16, 2012Barack Obama44%Mitt Romney48%41,733 LV±2.35%
Mitchell Research & Communications [109] August 13, 2012Barack Obama49%Mitt Romney44%51,079 LV±2.98%
EPIC-MRA [110] July 24–31, 2012Barack Obama48%Mitt Romney42%6600 LV±3.5%
Mitchell Research & Communications [111] July 23, 2012Barack Obama44%Mitt Romney45%1825 LV±3.4%
Rasmussen Reports/Pulse Opinion Research [112] July 23, 2012Barack Obama48%Mitt Romney42%6500 LV±4.5%
Public Policy Polling [113] July 21–23, 2012Barack Obama53%Mitt Romney39%14579 RV±4.1%
NBC News/Marist College [114] June 24–25, 2012Barack Obama47%Mitt Romney43%41,078 RV±3.0%
Mitchell Research & Communications [115] June 18, 2012Barack Obama47%Mitt Romney46%1750 LV±3.58%
We Ask America [84] June 18, 2012Barack Obama43%Mitt Romney45%21,010LV±3.0%
Lambert, Edwards & Associates/Denno Research [116] June 14–15, 2012Barack Obama40%Mitt Romney40%Tied600 LV±4%
Rasmussen Reports/Pulse Opinion Research [112] June 14, 2012Barack Obama50%Mitt Romney42%8500 LV±4.5%
Baydoun Consulting/Foster McCollum White & Associates [117] June 12, 2012Barack Obama46.89%Mitt Romney45.48%1.411,783±2.32%
EPIC-MRA [118] June 2–5, 2012Barack Obama45%Mitt Romney46%1600 LV±4%
Public Policy Polling [119] May 24–27, 2012Barack Obama53%Mitt Romney39%14500 RV±4.4%
Glengariff Group [120] May 10–11, 2012Barack Obama45%Mitt Romney40%5600 LV±4%
EPIC-MRA [121] March 31 – April 3, 2012Barack Obama47%Mitt Romney43%4600 LV±4%
Marketing Resource Group [122] March 14–19, 2012Barack Obama49%Mitt Romney42%7600 LV±4%
NBC News/Marist College [10] February 19–20, 2012Barack Obama55% Rick Santorum 29%263,149 RV±1.8%
56% Newt Gingrich 28%28
53% Ron Paul 31%22
51%Mitt Romney33%18
Public Policy Polling [123] February 10–12, 2012Barack Obama50%Rick Santorum39%11560 RV±4.14%
56%Newt Gingrich34%22
52%Ron Paul34%18
54%Mitt Romney38%16
Detroit Free Press/EPIC-MRA [124] January 21–25, 2012Barack Obama51%Newt Gingrich38%13600 LV±4%
48%Mitt Romney40%8

Minnesota

10 electoral votes
(Democratic in 2004) 51%–48%
(Democratic in 2008) 54%–44%

Poll sourceDate administeredDemocrat %Republican %Lead marginSample sizeMargin of error
KSTP-TV Minneapolis/SurveyUSA [125] July 17–19, 2012Barack Obama46%Mitt Romney40%6552 LV±4.3%
Public Policy Polling [126] May 31 – June 3, 2012Barack Obama54%Mitt Romney39%15973 RV±3.1%
KSTP-TV Minneapolis/Survey USA [127] May 9–10, 2012Barack Obama52%Mitt Romney38%14516 RV±4.4%
KSTP-TV Minneapolis/Survey USA [128] January 31 – February 2, 2012Barack Obama49%Mitt Romney36%13542 RV±4.3%
55% Newt Gingrich 29%26
48% Ron Paul 37%11
51% Rick Santorum 32%19
Public Policy Polling [129] January 21–22, 2012Barack Obama54%Newt Gingrich39%151,236 RV±2.8%
52%Rick Santorum40%12
51%Ron Paul38%13
51%Mitt Romney41%10

Missouri

10 electoral votes
(Republican in 2004) 53%–46%
(Republican in 2008) 49%–49%

Poll sourceDate administeredDemocrat %Republican %Lead marginSample sizeMargin of error
Public Policy Polling [130] August 28–29, 2012Barack Obama41%Mitt Romney53%12621 LV±3.9%
St. Louis Post-Dispatch/Mason-Dixon Polling & Research [131] August 22–23, 2012Barack Obama43%Mitt Romney50%7625 LV±4.0%
Rasmussen Reports/Pulse Opinion Research [132] August 22, 2012Barack Obama47%Mitt Romney46%1500 LV±4.5%
Public Policy Polling [133] August 20, 2012Barack Obama42%Mitt Romney52%10500 LV±4.4%
KSDK-TV St. Louis/KSHB-TV Kansas City/KSPR-TV Springfield/KYTV-TV Springfield/SurveyUSA [134] August 9–12, 2012Barack Obama44%Mitt Romney45%1585 LV±4.1%
Missouri Scout/Chilenski Strategies [135] August 8, 2012Barack Obama47%Mitt Romney48%1663LV±3.8%
Rasmussen Reports/Pulse Opinion Research [132] July 30, 2012Barack Obama44%Mitt Romney50%6500 LV±4.5%
We Ask America [136] July 24, 2012Barack Obama39.73%Mitt Romney49.01%9.281,172 LV±3.0%
Rasmussen Reports/Pulse Opinion Research [132] June 7, 2012Barack Obama42%Mitt Romney49%7500 LV±4.5%
Public Policy Polling [137] May 24–27, 2012Barack Obama45%Mitt Romney44%1602 RV±4.0%
Rasmussen Reports/Pulse Opinion Research [132] April 17, 2012Barack Obama45%Mitt Romney48%3500 LV±4.5%
Rasmussen Reports/Pulse Opinion Research [132] March 14–15, 2012Barack Obama42% Rick Santorum 51%9500 LV±4.5%
Barack Obama41%Mitt Romney50%9
Public Policy Polling [138] January 27–29, 2012Barack Obama49% Newt Gingrich 42%7582 RV±4.1%
Barack Obama45% Ron Paul 43%2
Barack Obama45%Mitt Romney45%Tied
Barack Obama47%Rick Santorum44%3

Three way race

Poll sourceDate administeredDemocrat %Republican % Libertarian  %Lead marginSample sizeMargin of error
Capitol Correspondent/North Star Campaign Systems/North Star Campaign Systems/Gravis Marketing (R) [139] August 23, 2012Barack Obama36.1%Mitt Romney53.1%Gary Johnson4.1%171,057 A±3.4%
We Ask America [136] July 24, 2012 Barack Obama 39.7% Mitt Romney 49.0% Gary Johnson 2.1%9.31,172 LV±3.0%

Montana

3 electoral votes
(Republican in 2004) 59%–39%
(Republican in 2008) 49%–47%

Poll sourceDate administeredDemocrat %Republican %Lead marginSample sizeMargin of error
Rasmussen Reports/Pulse Opinion Research [140] August 20, 2012Barack Obama38%Mitt Romney55%17500 LV±4.5%
Rasmussen Reports/Pulse Opinion Research [140] June 18, 2012Barack Obama42%Mitt Romney51%9500±5.0%
Rasmussen Reports/Pulse Opinion Research [140] May 2, 2012Barack Obama44%Mitt Romney51%7450 LV±5.0%
Public Policy Polling [141] April 26–29, 2012Barack Obama43%Mitt Romney48%5934 RV±3.2%
41% Ron Paul 49%8
Barack Obama45% Newt Gingrich 45%Tie
Rasmussen Reports/Pulse Opinion Research [140] February 22, 2012Barack Obama41%Mitt Romney48%7500 RV±4.5%
41% Rick Santorum 45%4

Three way race

Poll sourceDate administeredDemocrat %Republican % Libertarian  %Lead marginSample sizeMargin of error
Public Policy Polling [141] April 26–29, 2012Barack Obama41%Mitt Romney43%Gary Johnson8%2934±3.2%

Nebraska

5 electoral votes
(Republican in 2004) 66%–33%
(Republican in 2008) 57%–42%

Poll sourceDate administeredDemocrat %Republican %Lead marginSample sizeMargin of error
Rasmussen Reports/Pulse Opinion Research [142] May 16, 2012Barack Obama39%Mitt Romney53%14500 LV±4.5%
Public Policy Polling [143] March 22–25, 2012Barack Obama39%Mitt Romney51%121,028 RV±3.1%
38% Rick Santorum 55%17
40% Newt Gingrich 49%9
37% Ron Paul 49%12
Rasmussen Reports/Pulse Opinion Research [142] March 5, 2012Barack Obama35%Mitt Romney52%17500 LV±4.5%
37%Rick Santorum49%12

Second congressional district

Poll sourceDate administeredDemocrat%Republican%Lead marginSample sizeMargin of error
Public Policy Polling [143] March 22–25, 2012Barack Obama45%Mitt Romney46%1Not reportedNot reported
Barack Obama47%Rick Santorum47%Tied
Barack Obama46%Newt Gingrich44%2
Barack Obama42%Ron Paul44%2

Nevada

6 electoral votes
(Republican in 2004) 51%–48%
(Democratic in 2008) 55%–43%

Poll sourceDate administeredDemocrat %Republican %Lead marginSample sizeMargin of error
Public Policy Polling [144] August 23–26, 2012Barack Obama50%Mitt Romney47%3831 LV±3.4%
Las Vegas Review-Journal /SurveyUSA [145] August 16–21, 2012Barack Obama47%Mitt Romney45%2869 LV±3.4%
Rasmussen Reports/Pulse Opinion Research [146] July 24, 2012Barack Obama50%Mitt Romney45%5500 LV±4.5%
Magellan Strategies [147] July 16–17, 2012Barack Obama50%Mitt Romney46%4665 RV±3.8%
Public Policy Polling [148] June 7–10, 2012Barack Obama48%Mitt Romney42%6500 RV±4.4%
NBC News/Marist College [149] May 22–24, 2012Barack Obama48%Mitt Romney46%21,040 RV±3.0%
Rasmussen Reports/Pulse Opinion Research [146] April 30, 2012Barack Obama52%Mitt Romney44%8500 LV±4.5%
Public Policy Polling [150] March 29 – April 1, 2012Barack Obama51%Mitt Romney43%8533 RV±4.2%
54% Rick Santorum 40%14
49% Ron Paul 42%7
54% Newt Gingrich 39%15
Rasmussen Reports/Pulse Opinion Research [146] March 19, 2012Barack Obama50%Mitt Romney44%6500 LV±4.5%
52%Rick Santorum36%16

Three-way race

Poll sourceDate administeredDemocrat%Republican%Libertarian%Lead MarginSample sizeMargin of error
We Ask America [151] July 17–18, 2012Barack Obama49%Mitt Romney43%Gary Johnson2%61,092 LV±2.95%

New Hampshire

4 electoral votes
(Democratic in 2004) 50%–49%
(Democratic in 2008) 54%–45%

Poll sourceDate administeredDemocrat %Republican %Lead marginSample sizeMargin of error
Public Policy Polling [152] August 9–12, 2012Barack Obama51%Mitt Romney45%61,055 LV±3.0%
WMUR/University of New Hampshire [153] August 1–12, 2012Barack Obama49%Mitt Romney46%3555 LV±4.2%
Democracy for America/Public Policy Polling (D) [154] August 5–8, 2012Barack Obama50%Mitt Romney44%61,591 LV±2.5%
WMUR/University of New Hampshire [155] July 5–15, 2012Barack Obama49%Mitt Romney45%4470 LV±4.5%
NBC News/Marist College [156] June 24–25, 2012Barack Obama43%Mitt Romney42%11029 RV±3.1%
American Research Group [157] June 21–24, 2012Barack Obama49%Mitt Romney46%3417 LVNot reported
Rasmussen Reports/Pulse Opinion Research [158] June 20, 2012Barack Obama48%Mitt Romney43%5500 LV±4.5%
Public Policy Polling [159] May 10–13, 2012Barack Obama53%Mitt Romney41%121,163 RV±2.9%
WMUR/University of New Hampshire [160] April 9–20, 2012Barack Obama51%Mitt Romney42%9486 LV±4.4%
Dartmouth College [161] April 2–5, 2012Barack Obama42.4%Mitt Romney43.9%1.5403 RV±4.9%
American Research Group [157] March 15–18, 2012Barack Obama48%Mitt Romney46%2557 RVNot reported
WMUR/University of New Hampshire [162] January 25 – February 2, 2012Barack Obama50%Mitt Romney40%10495 LV±4.4%
50% Ron Paul 42%8
60% Newt Gingrich 35%25
56% Rick Santorum 35%21

Three way race

Poll sourceDate administeredDemocrat %Republican % Libertarian  %Lead marginSample sizeMargin of error
Public Policy Polling [163] May 10–13, 2012 Barack Obama 51% Mitt Romney 38% Gary Johnson 7%131,163±2.9%

New Jersey

14 electoral votes
(Democratic in 2004) 52%–46%
(Democratic in 2008) 57%–42%

Poll sourceDate administeredDemocrat %Republican %Lead marginSample sizeMargin of error
Rutgers University [164] August 23–25, 2012Barack Obama51%Mitt Romney37%14710 LV±3.5%
Monmouth University [165] July 18–22, 2012Barack Obama51%Mitt Romney38%13678 RV±3.8%
Quinnipiac University [166] July 9–15, 2012Barack Obama49%Mitt Romney38%111,623 RV±2.4%
Rutgers University [167] May 31 – June 4, 2012Barack Obama56%Mitt Romney33%231,065 RV±2.9%
Quinnipiac University [168] May 9–14, 2012Barack Obama49%Mitt Romney39%101,582±2.5%
Fairleigh Dickinson University (PublicMind) [169] April 30 – May 6, 2012Barack Obama50%Mitt Romney36%14797 RV±3.5%
Quinnipiac University [170] April 3–9, 2012Barack Obama49%Mitt Romney40%91,607 RV±2.4%
51% Rick Santorum 36%15
Quinnipiac University [171] February 21–27, 2012Barack Obama49%Mitt Romney39%101,396 RV±2.6%
55% Newt Gingrich 30%25
52%Rick Santorum34%18
WABC-TV New York/SurveyUSA [172] February 24–26, 2012Barack Obama52%Mitt Romney38%14533 RV±4.3%
61%Newt Gingrich27%34
57%Rick Santorum33%24
56% Ron Paul 31%25
Rutgers University [173] February 9–11, 2012Barack Obama56%Mitt Romney31%25914 RV±3.3%
Quinnipiac University [174] January 10–16, 2012Barack Obama48%Mitt Romney38%101,460 RV±2.6%

New Mexico

5 electoral votes
(Republican in 2004) 50%–49%
(Democratic in 2008) 57%–42%

Poll sourceDate administeredDemocrat %Republican %Lead marginSample sizeMargin of error
Rasmussen Reports/Pulse Opinion Research [175] August 21, 2012Barack Obama52%Mitt Romney38%14500 LV±4.5%
Public Policy Polling [176] July 13–16, 2012Barack Obama49%Mitt Romney44%5724 RV±3.6%
We Ask America [177] July 9–10, 2012Barack Obama51%Mitt Romney40%111,295 LV±2.8%
Patriot Majority/FM3 Research (D) [178] May 16–21, 2012Barack Obama48%Mitt Romney35%13502 RV±4.4%
Public Policy Polling [179] April 19–22, 2012Barack Obama54%Mitt Romney40%14526 RV±4.3%
Rasmussen Reports/Pulse Opinion Research [175] April 3, 2012Barack Obama53% Rick Santorum 38%15500 LV±4.5%
52%Mitt Romney36%16
Rasmussen Reports/Pulse Opinion Research [175] February 14, 2012Barack Obama55%Rick Santorum37%18500 LV±4.5%
55%Mitt Romney36%19

Three way race

Poll sourceDate administeredDemocrat %Republican % Libertarian  %Lead marginSample sizeMargin of error
Public Policy Polling [176] July 13–16, 2012Barack Obama42%Mitt Romney38%Gary Johnson13%4724±3.64%
Public Policy Polling [180] April 19–22, 2012Barack Obama48%Mitt Romney35%Gary Johnson15%13526±4.3%

New York

29 electoral votes
(Democratic in 2004) 58%–40%
(Democratic in 2008) 63%–36%

Poll sourceDate administeredDemocrat %Republican %Lead marginSample sizeMargin of error
Siena College [181] August 14–19, 2012Barack Obama62%Mitt Romney33%29671 LV±3.8%
Siena College [182] July 10–15, 2012Barack Obama61%Mitt Romney34%27758 RV±3.6%
Siena College [183] June 3–6, 2012Barack Obama59%Mitt Romney35%24807 RV±3.4%
Quinnipiac University [184] May 22–28, 2012Barack Obama56%Mitt Romney31%251,504 RV±2.5%
Siena College [183] May 6–10, 2012Barack Obama57%Mitt Romney37%20766 RV±3.5%
NY1/YNN/Marist College [185] April 10–12, 2012Barack Obama57%Mitt Romney35%22632 RV±4.0%
Siena College [183] April 1–4, 2012Barack Obama65% Newt Gingrich 29%36808 RV±3.4%
61% Ron Paul 31%30
60%Mitt Romney35%25
62% Rick Santorum 23%39
Quinnipiac University [186] March 28 – April 2, 2012Barack Obama56%Mitt Romney33%231,597 RV±2.5%
59%Rick Santorum30%29
Siena College [187] February 26–29, 2012Barack Obama60%Mitt Romney34%26808 RV±3.4%
64%Rick Santorum30%34
62%Ron Paul29%33
66%Newt Gingrich27%39
Quinnipiac University [188] February 8–13, 2012Barack Obama52%Mitt Romney35%171,233 RV±2.8%
57%Newt Gingrich31%26
53%Rick Santorum35%18

North Carolina

15 electoral votes
(Republican in 2004) 56%–44%
(Democratic in 2008) 50%–49%

Poll sourceDate administeredDemocrat %Republican %Lead marginSample sizeMargin of error
FOX 8/High Point University/SurveyUSA [189] August 26–30, 2012Barack Obama43%Mitt Romney46%3543 RV±4.3%
Elon University [190] August 25–30, 2012Barack Obama43%Mitt Romney47%41,089 LV±3%
CNN/Time/Opinion Research Corporation [44] August 22–26, 2012Barack Obama47%Mitt Romney48%1766 LV±3.5%
High Point University/SurveyUSA [191] August 18–23, 2012Barack Obama43%Mitt Romney43%Tied540 RV±4.3%
Public Policy Polling [192] August 2–5, 2012Barack Obama49%Mitt Romney46%3813 LV±3.4%
Rasmussen Reports/Pulse Opinion Research [193] August 1, 2012Barack Obama44%Mitt Romney49%5500 LV±4.5%
Civitas Institute/National Research (R) [194] July 16–18, 2012Barack Obama48%Mitt Romney49%1600 RV±4%
Public Policy Polling [195] July 5–8, 2012Barack Obama47%Mitt Romney46%1775 RV±3.5%
Project New America/Myers Research (D) [196] July 1–8, 2012Barack Obama48%Mitt Romney49%1500 LV±4.4%
Civitas Institute/SurveyUSA [197] June 29 – July 1, 2012Barack Obama45%Mitt Romney50%5558 RV±4.2%
Rasmussen Reports/Pulse Opinion Research [198] June 25, 2012Barack Obama44%Mitt Romney47%3500 LV±4.5%
NBC News/Marist College [199] June 24–25, 2012Barack Obama46%Mitt Romney44%21,019 RV±3.1%
Public Policy Polling [200] June 7–10, 2012Barack Obama46%Mitt Romney48%2810 RV±3.4%
WRAL-TV Raleigh/SurveyUSA May 18–21, 2012Barack Obama44%Mitt Romney45%1524 LV±4.4%
Civitas Institute/National Research (R) [201] May 19–20, 2012Barack Obama45%Mitt Romney47%2600 RV±4%
Rasmussen Reports/Pulse Opinion Research [198] May 14, 2012Barack Obama43%Mitt Romney51%8500 LV±4.5%
Public Policy Polling [202] May 10–13, 2012Barack Obama48%Mitt Romney47%1666 RV±3.8%
WRAL-TV Raleigh/Survey USA [203] April 26–30, 2012Barack Obama47%Mitt Romney43%41,636 RV±2.5%
Rasmussen Reports/Pulse Opinion Research [198] April 10, 2012Barack Obama44%Mitt Romney46%2500 LV±4.5%
Public Policy Polling [204] April 4–7, 2012Barack Obama51% Newt Gingrich 41%10975 RV±3.1%
48% Ron Paul 43%5
49%Mitt Romney44%5
50% Rick Santorum 44%6
Public Policy Polling [205] March 8–11, 2012Barack Obama51%Newt Gingrich42%9804 RV±3.5%
48%Ron Paul41%7
49%Mitt Romney46%3
49%Rick Santorum44%5
Public Policy Polling [206] February 3–5, 2012Barack Obama50%Newt Gingrich45%51,052 RV±3.0%
47%Ron Paul41%6
47%Mitt Romney46%1
48%Rick Santorum46%2
Civitas Institute/National Research (R) [207] January 9–11, 2012Barack Obama39%Mitt Romney48%9300 RV±4.0%
Public Policy Polling [208] January 5–8, 2012Barack Obama46%Mitt Romney45%1780 RV±3.5%
49%Newt Gingrich43%6
47%Ron Paul41%6
49% Rick Perry 41%8
Barack Obama46%Rick Santorum46%Tied

Three way race

Poll sourceDate administeredDemocrat %Republican % Libertarian  %Lead marginSample sizeMargin of error
Public Policy Polling [202] May 10–13, 2012 Barack Obama 46% Mitt Romney 44% Gary Johnson 6%2666±3.8%

North Dakota

3 electoral votes
(Republican in 2004) 63%–36%
(Republican in 2008) 53%–45%

Poll sourceDate administeredDemocrat %Republican %Lead marginSample sizeMargin of error
North Dakota Democratic-NPL State Party/DFM Research (D) [209] July 24–26, 2012Barack Obama35%Mitt Romney54%19400 LV±4.9%
Rasmussen Reports/Pulse Opinion Research [210] July 10–11, 2012Barack Obama36%Mitt Romney51%15400±5.0%
Mason-Dixon Polling & Research [211] June 4–6, 2012Barack Obama39%Mitt Romney52%13625 RV±4.0%

Ohio

18 electoral votes
(Republican in 2004) 51%–49%
(Democratic in 2008) 52%–47%

Poll sourceDate administeredDemocrat %Republican %Lead marginSample sizeMargin of error
Capitol Correspondent/Gravis Marketing [212] August 27, 2012Barack Obama45.27%Mitt Romney44.39%0.88728 LV±3.8%
Columbus Dispatch [213] August 15–25, 2012Barack Obama45%Mitt Romney45%Tied1,758 LV±2.1%
CBS News/New York Times/Quinnipiac University [45] August 21, 2012Barack Obama50%Mitt Romney44%61,253 LV±2.8%
University of Cincinnati [214] August 16–21, 2012Barack Obama49%Mitt Romney46%3847 LV±3.4%
Purple Strategies [28] August 13–14, 2012Barack Obama44%Mitt Romney46%2600 LV±4.0%
Rasmussen Reports/Pulse Opinion Research [215] August 13, 2012Barack Obama45%Mitt Romney45%Tied500 LV±4.5%
Public Policy Polling [216] August 9–12, 2012Barack Obama48%Mitt Romney45%3961 LV±3.2%
Quinnipiac University [217] July 24–30, 2012Barack Obama50%Mitt Romney44%61,193 LV±3.0%
We Ask America [218] July 24, 2012Barack Obama47.84%Mitt Romney40.2%7.641,115 LV±3.0%
Opportunity Ohio/Magellan Strategies (R) [219] July 23–24, 2012Barack Obama45%Mitt Romney43%2597 LV±4.01%
Rasmussen Reports/Pulse Opinion Research [215] July 18, 2012Barack Obama47%Mitt Romney45%2500 LV±4.5%
Purple Strategies [52] July 9–13, 2012Barack Obama48%Mitt Romney45%3600 LV±4.0%
Priorities USA Action/Garin-Hart-Yang Research Group (D) [220] June 25 – July 3, 2012Barack Obama48%Mitt Romney41%7608 LV±4.0%
Quinnipiac University [55] June 19–25, 2012Barack Obama47%Mitt Romney38%91,237 RV±2.8%
Public Policy Polling [221] June 21–24, 2012Barack Obama47%Mitt Romney44%3673 RV±3.8%
Purple Strategies [57] May 31 – June 5, 2012Barack Obama45%Mitt Romney48%3600 LV±4.0%
Rasmussen Reports/Pulse Opinion Research [215] May 29, 2012Barack Obama44%Mitt Romney46%2500 LV±4.5%
NBC News/Marist College [60] May 17–20, 2012Barack Obama48%Mitt Romney42%61,103RV±3.0%
Quinnipiac University [222] May 2–7, 2012Barack Obama45%Mitt Romney44%11,069 RV±3.0%
Public Policy Polling [223] May 3–6, 2012Barack Obama48% Ron Paul 40%8875 RV±3.3%
50%Mitt Romney43%7
Quinnipiac University [62] April 25 – May 1, 2012Barack Obama44%Mitt Romney42%21,130 RV±2.9%
Purple Strategies [63] April 19–23, 2012Barack Obama49%Mitt Romney44%5Not reported±4.1%
Rasmussen Reports/Pulse Opinion Research [215] April 18, 2012Barack Obama46%Mitt Romney42%4500 LV±4.5%
Fox News/Anderson Robbins/Shaw & Company [224] April 15–17, 2012Barack Obama45%Mitt Romney39%6606 RV±4.0%
Rasmussen Reports/Pulse Opinion Research [215] March 26, 2012Barack Obama48%Mitt Romney40%8500 LV±4.5%
47% Rick Santorum 41%6
Quinnipiac University [66] March 20–26, 2012Barack Obama47%Mitt Romney41%61,246 RV±2.8%
47%Rick Santorum40%7
NBC News/Marist College [225] February 29 – March 2, 2012Barack Obama50%Mitt Romney38%121573 RV±2.5%
51% Newt Gingrich 36%15
48%Ron Paul38%101505 RV
50%Rick Santorum36%14
Fox News/Anderson Robbins/Shaw & Company [226] February 11–13, 2012Barack Obama38%Mitt Romney44%6505 RV±4.5%
Barack Obama43%Newt Gingrich37%6
Barack Obama40%Rick Santorum43%3
Barack Obama41%Ron Paul42%1
Quinnipiac University [227] February 7–12, 2012Barack Obama50%Newt Gingrich38%121,421 RV±2.6%
47%Rick Santorum41%6
46%Ron Paul40%6
46%Mitt Romney44%2
Rasmussen Reports/Pulse Opinion Research [228] February 8, 2012Barack Obama44%Rick Santorum44%Tied500 LV±4.5%
Barack Obama45%Mitt Romney41%4
Public Policy Polling [229] January 28–29, 2012Barack Obama48%Rick Santorum42%6820 RV±3.4%
51%Newt Gingrich39%12
48%Ron Paul38%10
49%Mitt Romney42%7
Quinnipiac University [230] January 9–16, 2012Barack Obama48%Rick Santorum37%111,610 RV±2.4%
52%Newt Gingrich38%14
48%Ron Paul39%9
44%Mitt Romney42%2

Oklahoma

7 electoral votes
(Republican in 2004) 65.6%–34.4%
(Republican in 2008) 65.7%–34.4%

Poll sourceDate administeredDemocrat %Republican %Lead marginSample sizeMargin of error
SoonerPoll [231] July 26 – August 14, 2012Barack Obama29%Mitt Romney58%29495 LV±4.4%
SoonerPoll [232] May 7–10, 2012Barack Obama27%Mitt Romney62%35504 LV±4.4%

Oregon

7 electoral votes
(Democratic in 2004) 51%–47%
(Democratic in 2008) 57%–40%

Poll sourceDate administeredDemocrat %Republican %Lead marginSample sizeMargin of error
PPP [233] June 21–24, 2012Barack Obama50%Mitt Romney42%8686±3.7%
Survey USA [234] May 7–10, 2012Barack Obama47%Mitt Romney43%41,468±2.6%
Survey USA [235] March 14–19, 2012Barack Obama50%Mitt Romney39%111,615±2.5%
54% Newt Gingrich 34%20
49% Rick Santorum 40%9
48% Ron Paul 39%9

Pennsylvania

20 electoral votes
(Democratic in 2004) 51%–48%
(Democratic in 2008) 54%–44%

Poll sourceDate administeredDemocrat %Republican %Lead marginSample sizeMargin of error
Philadelphia Inquirer/Global Strategy Group/National Research Inc. [236] August 21–23, 2012Barack Obama51%Mitt Romney42%9601 LV±4%
Morning Call/Muhlenberg College [237] August 20–22, 2012Barack Obama49%Mitt Romney40%9422 LV±5%
Franklin and Marshall College [238] August 7–12, 2012Barack Obama47%Mitt Romney42%5681 RV±3.8%
Quinnipiac University [217] July 24–30, 2012Barack Obama53%Mitt Romney42%111,168 LV±3.0%
Public Policy Polling [113] July 21–23, 2012Barack Obama49%Mitt Romney43%6758 RV±3.6%
Republican State Committee of Pennsylvania/Susquehanna Polling & Research Inc. (R) [239] July 19–23, 2012Barack Obama46%Mitt Romney43%3800 LV±3.46%
Rasmussen Reports/Pulse Opinion Research [240] July 18, 2012Barack Obama48%Mitt Romney44%4500 LV±4.5%
We Ask America [177] July 9–10, 2012Barack Obama47%Mitt Romney40%71,227 LV±2.8%
Priorities USA Action/Garin-Hart-Yang Research Group (D) [220] June 25 – July 3, 2012Barack Obama49%Mitt Romney40%9608 LV±4.0%
Quinnipiac University [55] June 19–25, 2012Barack Obama45%Mitt Romney39%61,252 RV±2.8%
Quinnipiac University [241] June 5–10, 2012Barack Obama46%Mitt Romney40%6997 RV±3.1%
Franklin & Marshall College [242] May 29 – June 4, 2012Barack Obama48%Mitt Romney36%12412 RV±4.8%
Rasmussen Reports/Pulse Opinion Research [240] May 21, 2012Barack Obama47%Mitt Romney41%6500 LV±4.5%
Public Policy Polling [243] May 17–20, 2012Barack Obama50%Mitt Romney42%8671 RV±3.8%
Quinnipiac University [62] April 25 – May 1, 2012Barack Obama47%Mitt Romney39%81,168 RV±2.9%
Morning Call/Muhlenberg College [244] March 23 – April 1, 2012Barack Obama45%Mitt Romney40%5492 RV±5%
Quinnipiac University [66] March 20–26, 2012Barack Obama45%Mitt Romney42%31,232 RV±2.8%
48% Rick Santorum 41%7
Public Policy Polling [245] March 8–11, 2012Barack Obama49%Mitt Romney42%7689 RV±4.1%
51% Newt Gingrich 39%12
47% Ron Paul 41%6
48%Rick Santorum46%2
Quinnipiac University [246] March 7–11, 2012Barack Obama46%Mitt Romney40%61,256 RV±2.8%
50%Newt Gingrich37%13
45%Ron Paul40%5
45%Rick Santorum44%1
Rasmussen Reports/Pulse Opinion Research [240] February 8–23, 2012Barack Obama45%Mitt Romney44%1438 LV±4.5%
46%Rick Santorum40%6
Muhlenberg College/Morning Call [247] February 15–21, 2012Barack Obama48%Mitt Romney37%11625 RV±4.0%
49%Rick Santorum41%8
Franklin & Marshall College [248] February 14–20, 2012Barack Obama41%Mitt Romney33%8592 RV±4.0%
47%Newt Gingrich31%16
41%Ron Paul28%13
45%Rick Santorum37%8
Susquehanna Polling and Research [249] February 2–6, 2012Barack Obama43%Mitt Romney45%2800 RV±3.46%
Barack Obama47%Rick Santorum43%4

South Carolina

9 electoral votes
(Republican in 2004) 58%–41%
(Republican in 2008) 54%–45%

Poll sourceDate administeredDemocrat %Republican %Lead marginSample sizeMargin of error
Reuters/Ipsos [250] January 10–13, 2012Barack Obama40%Mitt Romney46%6995 RV±3.4%

South Dakota

3 electoral votes
(Republican in 2004) 60%–38%
(Republican in 2008) 53%–45%

Poll sourceDate administeredDemocrat %Republican %Lead marginSample sizeMargin of error
Nielson Brothers Polling [251] July 19–23, 2012 Barack Obama 43% Mitt Romney 49%6546 LV±4.19%

Tennessee

11 electoral votes
(Republican in 2004) 57%–43%
(Republican in 2008) 57%–42%

Poll sourceDate administeredDemocrat %Republican %Lead marginSample sizeMargin of error
Vanderbilt University/Princeton Survey Research Associates International [252] May 2–9, 2012Barack Obama40%Mitt Romney47%7826 RVNot reported
Middle Tennessee State University [253] February 13–25, 2012Barack Obama40% Newt Gingrich 45%4416 LV±4.0%
41% Ron Paul 44%3
41%Mitt Romney47%6
39% Rick Santorum 51%12
Vanderbilt University/Princeton Survey Research Associates International [254] February 16–22, 2012Barack Obama41%Newt Gingrich38%31,508 RV±3%
Barack Obama39%Ron Paul40%1
39%Mitt Romney42%3
38%Rick Santorum42%4

Texas

38 electoral votes
(Republican in 2004) 61%–38%
(Republican in 2008) 55%–44%

Poll sourceDate administeredDemocrat %Republican %Lead marginSample sizeMargin of error
University of Texas/Texas Tribune/YouGov [255] May 7–13, 2012Barack Obama35%Mitt Romney55%20511±4.34%
Public Policy Polling [256] April 19–22, 2012Barack Obama43%Mitt Romney50%7591 RV±4.0%
45% Newt Gingrich 47%2
43% Ron Paul 47%4
University of Texas/Texas Tribune/YouGov [257] February 8–15, 2012Barack Obama38%Newt Gingrich49%11527 LV±4.27%
36%Mitt Romney49%13529 LV±4.26%
37% Rick Santorum 51%14
35%Ron Paul44%9
Public Policy Polling [258] January 12–15, 2012Barack Obama47%Newt Gingrich45%2700 RV±3.7%
Barack Obama40%Ron Paul46%6
47% Rick Perry 48%1
42%Mitt Romney49%7
42%Rick Santorum49%7

Three way race

Poll sourceDate administeredDemocrat %Republican %Other candidates %Lead marginSample sizeMargin of error
Public Policy Polling [258] January 12–15, 2012 Barack Obama 39% Mitt Romney 47% Gary Johnson 7%8700 RV±3.7%
Barack Obama38%Mitt Romney40% Ron Paul*17%2

Utah

6 electoral votes
(Republican in 2004) 72%–26%
(Republican in 2008) 62%–34%

Poll sourceDate administeredDemocrat %Republican %Lead marginSample sizeMargin of error
Deseret News/KSL-TV/Dan Jones & Associates [259] June 21, 2012 Barack Obama 26% Mitt Romney 68%421,222 RV±2.8%

Vermont

3 electoral votes
(Democratic in 2004) 59%–39%
(Democratic in 2008) 67%–30%

Poll sourceDate administeredDemocrat %Republican %Lead marginSample sizeMargin of error
Castleton University [260] August 11–21, 2012Barack Obama62%Mitt Romney25%37477 RV±4.5%
WDEV/WCAX/Vermont Business Magazine/Castleton University [261] May 7–16, 2012Barack Obama59.3%Mitt Romney27.5%31.8607 RV±4.0%
Castleton University [262] February 11–22, 2012Barack Obama57%Mitt Romney31%26800 RV±3.5%
59% Rick Santorum 30%29
58% Ron Paul 28%30

Virginia

13 electoral votes
(Republican in 2004) 54%–46%
(Democratic in 2008) 53%–46%

Poll sourceDate administeredDemocrat %Republican %Lead marginSample sizeMargin of error
Rasmussen Reports/Pulse Opinion Research [263] August 23, 2012Barack Obama47%Mitt Romney47%Tied500 LV±4.5%
Public Policy Polling [264] August 16–19, 2012Barack Obama50%Mitt Romney45%5855 LV±3.4%
Purple Strategies [28] August 13–14, 2012Barack Obama45%Mitt Romney48%3600 LV±4.0%
Rasmussen Reports/Pulse Opinion Research [265] August 7, 2012Barack Obama48%Mitt Romney46%2500 LV±4.5%
CBS News/New York Times/Quinnipiac University [266] July 31 – August 6, 2012Barack Obama49%Mitt Romney45%41,412 LV±2.6%
Rasmussen Reports/Pulse Opinion Research [265] July 16–17, 2012Barack Obama47%Mitt Romney46%1500 LV±4.5%
Quinnipiac University [267] July 10–16, 2012Barack Obama44%Mitt Romney44%Tied1,673 RV±2.4%
Purple Strategies [52] July 9–13, 2012Barack Obama46%Mitt Romney44%2600 LV±4.0%
Public Policy Polling [195] July 5–8, 2012Barack Obama50%Mitt Romney42%8647 RV±3.9%
Priorities USA Action/Garin-Hart-Yang Research Group [32] June 25 – July 3, 2012Barack Obama46%Mitt Romney43%3608 LV±4%
We Ask America [33] June 25, 2012Barack Obama43.3%Mitt Romney48.0%4.71,106 LV±2.95%
Virginian Pilot/Old Dominion University [268] May 16 – June 15, 2012Barack Obama49%Mitt Romney42%7776 RV±3.5%
Purple Strategies [57] May 31 – June 5, 2012Barack Obama49%Mitt Romney46%3600 LV±4.0%
Quinnipiac University [269] May 30 – June 4, 2012Barack Obama47%Mitt Romney42%51,282 RV±2.7%
Rasmussen Reports/Pulse Opinion Research [265] June 3, 2012Barack Obama47%Mitt Romney47%Tied500 LV±4.5%
NBC News/Marist College [270] May 17–20, 2012Barack Obama48%Mitt Romney44%41,076 RV±3.0%
Washington Post [271] April 28 – May 2, 2012Barack Obama51%Mitt Romney44%7964 RV±4%
Public Policy Polling [272] April 26–29, 2012Barack Obama53% Newt Gingrich 37%16680 RV±3.8%
50% Ron Paul 39%11
51%Mitt Romney43%8
Rasmussen Reports/Pulse Opinion Research [265] April 23, 2012Barack Obama44%Mitt Romney45%1500 LV±4.5
Purple Strategies [63] April 19–23, 2012Barack Obama48%Mitt Romney46%2Not reported±4.1%
Roanoke College [273] March 26 – April 5, 2012Barack Obama40%Mitt Romney46%6603 A±4%
Rasmussen Reports/Pulse Opinion Research [274] March 20, 2012Barack Obama51%Mitt Romney42%9500 LV±4.5%
Quinnipiac University [275] March 13–18, 2012Barack Obama50%Mitt Romney42%81,034 RV±3.1%
54%Newt Gingrich35%19
49% Rick Santorum 40%9
49%Ron Paul39%10
NBC News/Marist College [276] February 29 – March 2, 2012Barack Obama52%Mitt Romney35%171,273 RV±2.8%
57%Newt Gingrich31%26
54%Rick Santorum32%221,245 RV
53%Ron Paul32%21
Roanoke College [277] February 13–26, 2012Barack Obama48%Newt Gingrich37%11607 A±4%
45%Rick Santorum39%6
45%Ron Paul35%10
Barack Obama42%Mitt Romney43%1
Rasmussen Reports/Pulse Opinion Research [265] February 21, 2012Barack Obama49%Mitt Romney43%6500 LV±4.5%
51%Rick Santorum43%8
Richmond Times-Dispatch/Muhlenberg College/Christopher Newport University [278] February 4–13, 2012Barack Obama45%Newt Gingrich40%51,018 RV±3.1%
Barack Obama43%Mitt Romney46%2
Barack Obama42%Rick Santorum46%4
Barack Obama43%Ron Paul43%Tie
Quinnipiac University [279] February 1–6, 2012Barack Obama47%Mitt Romney43%41,544 RV±2.5%
51%Newt Gingrich37%14
49%Rick Santorum41%8
47%Ron Paul40%7
Mason-Dixon Polling & Research [280] January 16–18, 2012Barack Obama45%Mitt Romney44%1625 RV±3.9%
49%Newt Gingrich38%11

Three way race

Poll sourceDate administeredDemocrat %Republican % Constitution Party  %Lead marginSample sizeMargin of error
Public Policy Polling [195] July 5–8, 2012 Barack Obama 49% Mitt Romney 35% Virgil Goode 9%14647±3.9%
Public Policy Polling [272] April 26–29, 2012Barack Obama50%Mitt Romney38%Virgil Goode5%12680±3.8%

Washington

12 electoral votes
(Democratic in 2004) 53%–46%
(Democratic in 2008) 57%–40%

Poll sourceDate administeredDemocrat %Republican %Lead marginSample sizeMargin of error
Moore Information [281] August 6–7, 2012Barack Obama46%Mitt Romney36%10500 LV±4%
KING-TV Seattle/SurveyUSA [282] August 2–3, 2012Barack Obama54%Mitt Romney37%17524 LV±4.4%
KING-TV Seattle/SurveyUSA July 16–18, 2012Barack Obama46%Mitt Romney37%9630 RV±4%
Public Policy Polling [283] June 14–17, 2012Barack Obama54%Mitt Romney41%131,073 RV±3.0%
Elway Research [284] June 13–16, 2012Barack Obama49%Mitt Romney41%8408 RV±5%
KING-TV Seattle/SurveyUSA [285] May 8–9, 2012Barack Obama50%Mitt Romney36%14557 RV±4.2%
Public Policy Polling [286] February 16–19, 2012Barack Obama55% Newt Gingrich 35%201,264 RV±2.76%
53%Mitt Romney38%15
51% Ron Paul 38%13
52% Rick Santorum 40%12
KING-TV Seattle/SurveyUSA [287] February 13–15, 2012Barack Obama56%Newt Gingrich34%22572 RV±4.2%
50%Mitt Romney39%11
50%Ron Paul37%13
51%Rick Santorum38%13

West Virginia

5 electoral votes
(Republican in 2004) 56%–43%
(Republican in 2008) 56%–43%

Poll sourceDate administeredDemocrat %Republican %Lead marginSample sizeMargin of error
R.L. Repass & Partners [288] August 22–25, 2012Barack Obama38%Mitt Romney52%14401 LV±4.9%
R.L. Repass & Partners [289] April 25–28, 2012Barack Obama37%Mitt Romney54%17410 RV±4.8%

Wisconsin

10 electoral votes
(Democratic in 2004) 50%–49%
(Democratic in 2008) 56%–42%

Poll sourceDate administeredDemocrat %Republican %Lead marginSample sizeMargin of error
CBS News/New York Times/Quinnipiac University [45] August 15–21, 2012Barack Obama49%Mitt Romney47%21,190 LV±3%
Marquette Law School [290] August 16–19, 2012Barack Obama49%Mitt Romney46%3576 LV±4.2%
Public Policy Polling [291] August 16–19, 2012Barack Obama47%Mitt Romney48%11,308 LV±2.7%
Rasmussen Reports/Pulse Opinion Research [292] August 15, 2012Barack Obama47%Mitt Romney48%1500 LV±4.5%
CNN/Opinion Research Corporation [293] August 13–14, 2012Barack Obama49%Mitt Romney45%4920 RV±3.0%
CBS News/New York Times/Quinnipiac University [266] July 31 – August 6, 2012Barack Obama51%Mitt Romney45%61,428±2.6%
Marquette Law School [294] August 2–5, 2012Barack Obama50%Mitt Romney45%51,188 LV±2.9%
Rasmussen Reports/Pulse Opinion Research [292] July 25, 2012Barack Obama49%Mitt Romney46%3500 LV±4.5%
We Ask America [151] July 17–18, 2012Barack Obama49%Mitt Romney42%71,162 LV±2.93%
Marquette Law School [295] July 5–8, 2012Barack Obama51%Mitt Romney43%8810 LV±3.5%
Public Policy Polling [296] July 5–8, 2012Barack Obama50%Mitt Romney44%61,057 LV±3.3%
Marquette Law School [297] June 13–16, 2012Barack Obama49%Mitt Romney43%6594 LV±4.1%
Rasmussen Reports/Pulse Opinion Research [292] June 12, 2012Barack Obama44%Mitt Romney47%3500 LV±4.5%
We Ask America [298] June 3, 2012Barack Obama48%Mitt Romney43%51,275 LV±2.75%
Marquette Law School [299] May 23–26, 2012Barack Obama51%Mitt Romney43%8600 LV±4%
St. Norbert College [300] May 17–22, 2012Barack Obama49%Mitt Romney43%6406 LV±5.0%
Daily Kos/Public Policy Polling [301] May 11–13, 2012Barack Obama47%Mitt Romney46%1851 RV±3.4%
Marquette Law School [302] May 9–12, 2012Barack Obama46%Mitt Romney46%Tied600 LV±4.1%
Rasmussen Reports/Pulse Opinion Research [292] May 9, 2012Barack Obama49%Mitt Romney45%4500 LV±4.5%
Marquette Law School [303] April 26–29, 2012Barack Obama51%Mitt Romney42%9705 RV±3.8%
Daily Kos/Public Policy Polling [304] April 13–15, 2012Barack Obama50%Mitt Romney44%61,136 RV±2.9%
Rasmussen Reports/Pulse Opinion Research [292] March 27, 2012Barack Obama56% Newt Gingrich 31%25500 LV±4.5%
52%Mitt Romney41%11
NBC News/Marist College [305] March 22–27, 2012Barack Obama52%Mitt Romney35%171,391 RV±2.6%
51% Rick Santorum 38%13
51%Rick Santorum39%121,400 RV
51% Ron Paul 36%15
Marquette Law School [306] March 22–25, 2012Barack Obama48%Mitt Romney43%5707 RV±3.7%
51%Rick Santorum39%12
53%Newt Gingrich36%17
50%Ron Paul40%10
Rasmussen Reports/Pulse Opinion Research [292] February 27, 2012Barack Obama47%Mitt Romney42%5500 LV±4.5%
46%Rick Santorum41%5
Public Policy Polling [307] February 23–26, 2012Barack Obama55%Newt Gingrich37%18900 RV±3.27%
53%Ron Paul37%16
53%Mitt Romney39%14
49%Rick Santorum43%6
Marquette Law School [308] February 16–19, 2012Barack Obama53%Mitt Romney38%15716 RV±3.7%
51%Rick Santorum40%11
56%Newt Gingrich33%23
52%Ron Paul36%16
Marquette Law School [309] January 19–22, 2012Barack Obama48%Mitt Romney40%8701 RV±3.8%

Three way race

Poll sourceDate administeredDemocrat %Republican % Libertarian  %Lead marginSample sizeMargin of error
Reason-Rupe [310] May 14–18, 2012Barack Obama46%Mitt Romney36%Gary Johnson6%10708±3.7%

See also

Notes

  1. "Capital Survey Research Center" (PDF). Archived from the original (PDF) on November 14, 2012.
  2. Talbot, George (July 2, 2012). "Romney leads Obama in Alabama poll, but voters question his Mormon faith (Political Skinny)". al.
  3. "2012 Arizona: Romney vs. Obama | RealClearPolling". www.realclearpolling.com.
  4. 1 2 "Election 2012: Arizona President". www.rasmussenreports.com.
  5. "Project New America/Public Policy Polling (D)" (PDF). Archived from the original (PDF) on August 28, 2012.
  6. "Public Policy Polling" (PDF).
  7. "DC London/Magellan Strategies (R)" (PDF). Archived from the original (PDF) on May 14, 2012.
  8. "Behavior Research Center (Rocky Mountain Poll" (PDF).
  9. "Poll: Obama/Romney race a toss-up in Arizona". TucsonSentinel.com.
  10. 1 2 "First Read - NBC poll: Romney, Santorum deadlocked in Michigan; Romney leads in Arizona". February 22, 2012. Archived from the original on February 22, 2012.
  11. "Public Policy Polling" (PDF).
  12. "Behavior Research Center (Rocky Mountain Poll)" (PDF). Archived from the original (PDF) on September 12, 2012.
  13. "Public Policy Polling". Archived from the original on March 26, 2019. Retrieved June 22, 2022.{{cite web}}: CS1 maint: bot: original URL status unknown (link)
  14. Brock, Roby (March 27, 2012). "Obama Holding Democrats, But Failing With Independent Voters".
  15. "Policy Analysis for California Education/USC Rossier School of Education/Tulchin Research" (PDF).
  16. "CBRT/Pepperdine University/M4 Strategies" (PDF).
  17. "Field Research Corporation (Field Poll)" (PDF). Archived from the original (PDF) on September 1, 2012.
  18. "SurveyUSA Election Poll #19276". www.surveyusa.com.
  19. "Field Research Corporation (Field Poll)" (PDF). Archived from the original (PDF) on August 19, 2012.
  20. "USC Dornsife/Los Angeles Times Poll: Gay Marriage Not a Key Voting Issue for 75 Percent of CA Voters > USC Dana and David Dornsife College of Letters, Arts and Sciences". June 2, 2012. Archived from the original on June 2, 2012.
  21. "Public Policy Institute of California" (PDF).
  22. "SurveyUSA Election Poll #19109". www.surveyusa.com.
  23. "California voters on presidential republican candidates - latimes.com". Los Angeles Times . March 25, 2012. Archived from the original on March 25, 2012.
  24. "Field Research Corporation (Field Poll)" (PDF). Archived from the original (PDF) on March 12, 2012.
  25. "Election 2012: California President". www.rasmussenreports.com.
  26. "SurveyUSA Election Poll #18974". www.surveyusa.com.
  27. "Keating Research/OnSight Public Affairs" (PDF). Archived from the original (PDF) on September 7, 2012.
  28. 1 2 3 4 "Purple Strategies" (PDF). Archived from the original (PDF) on October 16, 2012.
  29. 1 2 "Election 2012: Colorado President". www.rasmussenreports.com.
  30. 1 2 Public Policy Polling
  31. "Purple Strategies" (PDF). Archived from the original (PDF) on September 7, 2012.
  32. 1 2 3 "Priorities USA Action Blog". July 11, 2012. Archived from the original on July 11, 2012.
  33. 1 2 "VA & CO | weaskamerica.com". June 26, 2012. Archived from the original on June 26, 2012.
  34. 1 2 "Public Policy Polling" (PDF).
  35. "Purple Strategies" (PDF). Archived from the original (PDF) on June 7, 2012.
  36. "NBC News/Marist College" (PDF). Archived from the original (PDF) on October 5, 2012.
  37. "Project New America/Keating Research/OnSight Public Affairs (D)" (PDF). Archived from the original (PDF) on June 11, 2012.
  38. Purple Strategies
  39. "Public Policy Polling" (PDF).
  40. "Quinnipiac University". Archived from the original on September 19, 2012.
  41. "Election 2012: Connecticut President". www.rasmussenreports.com.
  42. "Quinnipiac University". Archived from the original on September 27, 2012.
  43. "Quinnipiac University". Archived from the original on March 22, 2012.
  44. 1 2 "CNN/Time/Opinion Research Corporation" (PDF).
  45. 1 2 3 "The Latest Quinnipiac University/New York Times/CBS Poll". archive.nytimes.com.
  46. "Florida | PDF | Chi Squared Distribution | Correlation And Dependence". Scribd.
  47. "FMWB-Fulmer & Associates Aggregate Polling Study Report for Florida General Election | PDF". Scribd.
  48. 1 2 3 4 5 "Election 2012: Florida President". www.rasmussenreports.com.
  49. "CBS News/New York Times/Quinnipiac University". CBS News .
  50. "Public Policy Polling" (PDF).
  51. "SurveyUSA Election Poll #19398". www.surveyusa.com.
  52. 1 2 3 "Purple Strategies" (PDF). Archived from the original (PDF) on September 7, 2012.
  53. 1 2 "July 2012 Florida Decides Poll: Obama, Romney in dead heat". October 17, 2012. Archived from the original on October 17, 2012.
  54. "Tight in Florida | weaskamerica.com". September 19, 2012. Archived from the original on September 19, 2012.
  55. 1 2 3 "Quinnipiac University". Archived from the original on October 8, 2012.
  56. "Quinnipiac University". Archived from the original on June 23, 2012.
  57. 1 2 3 "Purple Strategies" (PDF). Archived from the original (PDF) on June 7, 2012.
  58. "Public Policy Polling" (PDF).
  59. "Quinnipiac University". Archived from the original on October 8, 2012.
  60. 1 2 "NBC News/Marist College" (PDF). Archived from the original (PDF) on October 5, 2012.
  61. "Suffolk University/7News" (PDF). Archived from the original (PDF) on October 4, 2012.
  62. 1 2 3 "Quinnipiac University". Archived from the original on October 7, 2012.
  63. 1 2 3 "Purple Strategies" (PDF). Archived from the original (PDF) on May 10, 2012.
  64. Fox News/Anderson Robbins/Shaw & Company
  65. "Public Policy Polling" (PDF).
  66. 1 2 3 "Quinnipiac University". Archived from the original on September 13, 2012.
  67. "Home of the Marist Poll | Polls, Analysis, Learning, and More". maristpoll.marist.edu.
  68. "Mason-Dixon Research & Polling/Miami Herald/El Nuevo Herald".[ permanent dead link ]
  69. "Suffolk University" (PDF). Archived from the original (PDF) on May 2, 2012.
  70. "Quinnipiac University". Archived from the original on September 4, 2012.
  71. "Poll: Romney and Obama even in Florida; 64% want more Everglades spending | Post on Politics". July 4, 2012. Archived from the original on July 4, 2012.
  72. "Quinnipiac University". Archived from the original on September 2, 2012.
  73. "20/20 Insight" (PDF).
  74. "Majority Opinion Research/InsiderAdvantage" (PDF).
  75. "Rosetta Stone Communications/Landmark Communications" (PDF).
  76. "SurveyUSA Election Poll #19023". www.surveyusa.com.
  77. "Illinois voters favor Obama over Romney, but the president's support isn't as strong as in 2008". Crain's Chicago Business.
  78. "WGN-TV/Chicago Tribune". Archived from the original on January 19, 2013.
  79. 1 2 "Election 2012: Indiana President". www.rasmussenreports.com.
  80. "Howey Politics/DePauw University/Bellwether Research/Garin-Hart-Yang Research Group". Archived from the original on August 10, 2012.
  81. "Public Policy Polling" (PDF).
  82. 1 2 "Election 2012: Iowa President". www.rasmussenreports.com.
  83. "Public Policy Polling" (PDF).
  84. 1 2 "IA & MI | weaskamerica.com". October 11, 2012. Archived from the original on October 11, 2012.
  85. "NBC News/Marist College" (PDF). Archived from the original (PDF) on October 5, 2012.
  86. "Public Policy Polling" (PDF).
  87. "Des Moines Register/Selzer & Co". The Des Moines Register .[ permanent dead link ]
  88. "Press Herald Poll: President leading race in Maine". Press Herald. July 11, 2012.
  89. "WBUR Poll: Angus King Heavy Favorite To Replace Sen. Snowe | PDF | Opinion Poll | Democratic Party (United States)". Scribd.
  90. "Poll: Mainers more 'favorable' on Romney". Kennebec Journal and Morning Sentinel. May 12, 2012.
  91. "Public Policy Polling" (PDF).
  92. "Marylanders for Marriage Equality/Public Policy Polling (D)" (PDF).
  93. "Kimball Political Consulting" (PDF). Archived from the original (PDF) on August 31, 2012.
  94. "Public Policy Polling" (PDF).
  95. 1 2 "Public Policy Polling" (PDF).
  96. "Complete poll results & methodology: WNEU/The Republican/MassLive.com Massachusetts U.S. Senate Race poll". masslive. June 2, 2012.
  97. "The Boston Globe/University of New Hampshire" (PDF). Archived from the original (PDF) on June 17, 2012.
  98. "Suffolk University" (PDF). Archived from the original (PDF) on October 4, 2012.
  99. 1 2 3 "Election 2012: Massachusetts President". www.rasmussenreports.com.
  100. "Brown, Warren deadlocked, poll shows - Boston.com". May 28, 2012. Archived from the original on May 28, 2012.
  101. "Public Policy Polling" (PDF).
  102. "MassLive.com/The Republican/Western New England University" (PDF). Archived from the original (PDF) on March 12, 2012.
  103. "Suffolk University" (PDF). Archived from the original (PDF) on March 3, 2012.
  104. "Poll Shows Brown Leading Warren by 10 - Hotline On Call - Hotline On Call". March 1, 2012. Archived from the original on March 1, 2012.
  105. "EPIC-MRA".
  106. "Mitchell Research & Communications" (PDF).
  107. "Detroit News/Glengariff Group". Archived from the original on October 7, 2012.
  108. "FOX 2 Detroit". FOX 2 Detroit. August 8, 2024. Archived from the original on August 24, 2012.
  109. "Mitchell Prez-Press 8-14-12 WDIV-TV Det News X-Tabs | PDF | Michigan | Democratic Party (United States)". Scribd.
  110. "EXCLUSIVE POLL: Obama back in front, Hoekstra holds big lead on Durant". January 14, 2013. Archived from the original on January 14, 2013.
  111. "Mitchell Research & Communications".[ permanent dead link ]
  112. 1 2 "Election 2012: Michigan President". www.rasmussenreports.com.
  113. 1 2 "Public Policy Polling" (PDF).
  114. "NBC News/Marist College" (PDF). Archived from the original (PDF) on October 5, 2012.
  115. "Mitchell Research & Communications" (PDF).
  116. Eggert, David (June 25, 2012). "Poll shows tie race in Michigan: Romney up among independents, Obama's base more excited". mlive.
  117. "Foster McCollum White & Associates & Baydoun Consulting Michigan Poll (June 2012) | PDF | Opinion Poll | Michigan". Scribd.
  118. "EPIC-MRA" (PDF). Archived from the original (PDF) on March 6, 2016.
  119. "Public Policy Polling" (PDF).
  120. "Glengariff Group".[ permanent dead link ]
  121. "EPIC-MRA" (PDF).
  122. Marketing Resource Group
  123. "Public Policy Polling" (PDF).
  124. "Detroit Free Press/EPIC-MRA".
  125. "KSTP-TV Minneapolis/SurveyUSA". Archived from the original on November 1, 2012.
  126. "Public Policy Polling" (PDF).
  127. "SurveyUSA News Poll #19209". www.surveyusa.com.
  128. "SurveyUSA News Poll #18953". www.surveyusa.com.
  129. "Public Policy Polling" (PDF).
  130. "Public Policy Polling" (PDF).
  131. kmcdermott@post-dispatch.com > 314-340-8268, KEVIN McDERMOTT • (August 26, 2012). "Poll shows Akin now trails McCaskill in Missouri Senate race". STLtoday.com.{{cite web}}: CS1 maint: numeric names: authors list (link)
  132. 1 2 3 4 5 "Election 2012: Missouri President". www.rasmussenreports.com.
  133. "Public Policy Polling" (PDF).
  134. "SurveyUSA Election Poll #19479". www.surveyusa.com.
  135. "MO-Sen, MO-Gov Chilenski Strategies For Missouri Scout (Aug. 2012) | PDF | Democratic Party (United States) | American Government". Scribd.
  136. 1 2 "MO Big 10 | weaskamerica.com". October 15, 2012. Archived from the original on October 15, 2012.
  137. "Public Policy Polling" (PDF).
  138. "Public Policy Polling" (PDF).
  139. "Gravis Missouri Poll - Romney Up-Akin in Trouble (August 24, 2012) 2 | PDF | Mitt Romney | American Government". Scribd.
  140. 1 2 3 4 "Election 2012: Montana President". www.rasmussenreports.com.
  141. 1 2 "Public Policy Polling" (PDF).
  142. 1 2 "Election 2012: Nebraska President". www.rasmussenreports.com.
  143. 1 2 "Public Policy Polling" (PDF).
  144. "Public Policy Polling" (PDF).
  145. "Las Vegas News | Breaking News & Headlines". Las Vegas Review-Journal. August 7, 2024. Archived from the original on September 24, 2012. Retrieved November 7, 2012.
  146. 1 2 3 "Election 2012: Nevada President". www.rasmussenreports.com.
  147. "Magellan Strategies" (PDF). Archived from the original (PDF) on July 22, 2012.
  148. "Public Policy Polling" (PDF).
  149. "NBC News/Marist College" (PDF). Archived from the original (PDF) on May 31, 2012.
  150. "Public Policy Polling" (PDF).
  151. 1 2 "NV & WI | weaskamerica.com". Archived from the original on October 10, 2012.
  152. "Public Policy Polling" (PDF).
  153. "WMUR/University of New Hampshire". Archived from the original on August 16, 2012.
  154. "New Hampshire Over All Results | PDF | Democratic Party (United States) | American Government". Scribd.
  155. "WMUR/University of New Hampshire". Archived from the original on September 29, 2012.
  156. "NBC News/Marist College" (PDF). Archived from the original (PDF) on October 5, 2012.
  157. 1 2 "2012 NH US President Ballot". americanresearchgroup.com.
  158. "Election 2012: New Hampshire President". www.rasmussenreports.com.
  159. "Public Policy Polling" (PDF).
  160. "WMUR/University of New Hampshire" (PDF). Archived from the original (PDF) on July 20, 2012.
  161. "Dartmouth College" (PDF). Archived from the original (PDF) on September 15, 2012.
  162. WMUR/University of New Hampshire
  163. "Public Policy Polling" (PDF).
  164. "Rutgers University" (PDF). Archived from the original (PDF) on November 14, 2012.
  165. "Monmouth University" (PDF). Archived from the original (PDF) on October 28, 2012.
  166. "Quinnipiac University". Archived from the original on October 9, 2012.
  167. "Rutgers University" (PDF). Archived from the original (PDF) on October 5, 2012.
  168. "Quinnipiac University". Archived from the original on October 9, 2012.
  169. "Obama and Christie get similar love; Romney's uphill battle among women". publicmind.fdu.edu.
  170. "Quinnipiac University". Archived from the original on September 12, 2012.
  171. "Quinnipiac University". Archived from the original on September 12, 2012.
  172. "SurveyUSA News Poll #19029". www.surveyusa.com.
  173. "Rutgers University" (PDF). Archived from the original (PDF) on March 12, 2012.
  174. "Quinnipiac University". Archived from the original on September 13, 2012.
  175. 1 2 3 "Election 2012: New Mexico President". www.rasmussenreports.com.
  176. 1 2 "Public Policy Polling" (PDF).
  177. 1 2 "PA & NM | weaskamerica.com". July 12, 2012. Archived from the original on July 12, 2012.
  178. "Patriot Majority/FM3 Research (D)" (PDF). Archived from the original (PDF) on September 19, 2012.
  179. "Public Policy Polling" (PDF).
  180. "Obama has big leads in New Mexico". Public Policy Polling. April 25, 2012.
  181. "Siena College" (PDF). Archived from the original (PDF) on October 4, 2012.
  182. "Siena College" (PDF). Archived from the original (PDF) on October 4, 2012.
  183. 1 2 3 "Siena College Research Institute – The preeminent academically situated polling institute in New York State" (PDF). Archived from the original (PDF) on April 24, 2012.
  184. "Quinnipiac University". Archived from the original on October 4, 2012.
  185. NY1/YNN/Marist College [ permanent dead link ]
  186. "Quinnipiac University". Archived from the original on October 8, 2012.
  187. "Siena College" (PDF). Archived from the original (PDF) on September 14, 2012.
  188. "Quinnipiac University". Archived from the original on September 13, 2012.
  189. "FOX 8/High Point University/SurveyUSA". September 3, 2012.
  190. Elon University
  191. "High Point University/SurveyUSA". Archived from the original on August 9, 2021.
  192. "Public Policy Polling" (PDF).
  193. "Rasmussen Reports/Pulse Opinion Research". Archived from the original on August 9, 2021.
  194. "Civitas Poll: Obama Negatives Hit 50 Percent, Romney Maintains Lead in North Carolina". Civitas Institute. July 20, 2012.
  195. 1 2 3 "Public Policy Polling" (PDF).
  196. "Project New America/Myers Research (D)" (PDF).
  197. "Civitas Poll: Romney Leads in NC after Court Ruling". Civitas Institute. July 3, 2012.
  198. 1 2 3 "Election 2012: North Carolina President". www.rasmussenreports.com.
  199. "NBC News/Marist College" (PDF). Archived from the original (PDF) on October 5, 2012.
  200. "Public Policy Polling" (PDF).
  201. "Civitas Poll: Independents propel Romney to lead in NC". Civitas Institute. May 24, 2012.
  202. 1 2 "Public Policy Polling" (PDF).
  203. "SurveyUSA Election Poll #19169". www.surveyusa.com.
  204. "Public Policy Polling" (PDF).
  205. "Public Policy Polling" (PDF).
  206. "Public Policy Polling" (PDF).
  207. Civitas Institute/National Research (R)
  208. "Public Policy Polling" (PDF).
  209. "North Dakota Democratic-NPL State Party/DFM Research (D)" (PDF).
  210. "Election 2012: North Dakota President". www.rasmussenreports.com.
  211. "Primary Election Poll: House and President on KFYR-TV North Dakota's NBC News Leader". Archived from the original on July 22, 2012.
  212. "Ohio (August 28, 2012) 2 | PDF | Democratic Party (United States) | American Government". Scribd.
  213. "Columbus Dispatch".
  214. University of Cincinnati
  215. 1 2 3 4 5 "Election 2012: Ohio President". www.rasmussenreports.com.
  216. "Public Policy Polling" (PDF).
  217. 1 2 "Quinnipiac University". CBS News .
  218. "OH-bama | weaskamerica.com". Archived from the original on October 1, 2012.
  219. "Opportunity Ohio/Magellan Strategies (R)" (PDF).
  220. 1 2 "Priorities USA Action Blog". Archived from the original on July 11, 2012.
  221. "Public Policy Polling" (PDF).
  222. "Quinnipiac University". Archived from the original on September 13, 2012.
  223. "Public Policy Polling" (PDF).
  224. Fox News/Anderson Robbins/Shaw & Company
  225. "First Read - NBC News/Marist poll: Santorum, Romney neck and neck in Ohio". March 4, 2012. Archived from the original on March 4, 2012.
  226. "Fox News/Anderson Robbins/Shaw & Company". Fox News .
  227. "Quinnipiac University". Archived from the original on September 13, 2012.
  228. "Election 2012: Ohio President". www.rasmussenreports.com.
  229. "Public Policy Polling" (PDF).
  230. "Quinnipiac University". Archived from the original on September 13, 2012.
  231. "SoonerPoll". Archived from the original on September 28, 2012.
  232. "SoonerPoll". Archived from the original on July 4, 2012.
  233. "PPP" (PDF). Archived from the original (PDF) on March 4, 2016.
  234. "SurveyUSA Election Poll #19214". www.surveyusa.com.
  235. "SurveyUSA Election Poll #19071". www.surveyusa.com.
  236. Infield, Tom (August 25, 2012). "New poll shows Obama with a significant lead over Romney in Pa". inquirer.com.
  237. "Morning Call/Muhlenberg College". Archived from the original on November 5, 2013.
  238. "Franklin and Marshall College" (PDF). Archived from the original (PDF) on October 23, 2012.
  239. Republican State Committee of Pennsylvania/Susquehanna Polling & Research Inc. (R)
  240. 1 2 3 "Election 2012: Pennsylvania President". www.rasmussenreports.com.
  241. "Quinnipiac University". Archived from the original on October 8, 2012.
  242. "Franklin & Marshall College" (PDF). Archived from the original (PDF) on October 4, 2012.
  243. "Public Policy Polling" (PDF).
  244. "The Morning Call/Muhlenberg College April 2012 Quality of Life Poll | PDF | Politics Of The United States | American Government". Scribd.
  245. "Public Policy Polling" (PDF).
  246. "Quinnipiac University". Archived from the original on September 13, 2012.
  247. "Read: Entire poll results 'Pennsylvania and Rick Santorum' - mcall.com". July 20, 2012. Archived from the original on July 20, 2012.
  248. "Franklin & Marshall College" (PDF). Archived from the original (PDF) on May 23, 2012.
  249. Susquehanna Polling and Research
  250. "Reuters/Ipsos". Reuters .
  251. "Final July Survey Candidates and Issues | PDF". Scribd.
  252. "Vanderbilt University/Princeton Survey Research Associates International" (PDF).
  253. "Middle Tennessee State University" (PDF). Archived from the original (PDF) on January 29, 2013.
  254. "Vanderbilt University/Princeton Survey Research Associates International" (PDF).
  255. "University of Texas/Texas Tribune/YouGov" (PDF).
  256. "Public Policy Polling" (PDF).
  257. "University of Texas/Texas Tribune/YouGov" (PDF). Archived from the original (PDF) on March 12, 2012.
  258. 1 2 "Public Policy Polling" (PDF).
  259. "Deseret News/KSL-TV/Dan Jones & Associates". Deseret News .
  260. "Castleton University". Archived from the original on July 23, 2013.
  261. "Poll: Shumlin would win gubernatorial race - WCAX.COM Local Vermont News, Weather and Sports-". Archived from the original on May 22, 2012.
  262. "February 27, 2012 Castleton Poll Results · Castleton University". July 3, 2017. Archived from the original on July 3, 2017.
  263. "Rasmussen Reports/Pulse Opinion Research". Archived from the original on August 10, 2021.
  264. "Public Policy Polling" (PDF).
  265. 1 2 3 4 5 "Election 2012: Virginia President". www.rasmussenreports.com.
  266. 1 2 "Quinnipiac University/New York Times/CBS Poll on Swing States". archive.nytimes.com.
  267. "Quinnipiac University". Archived from the original on September 25, 2012.
  268. "The Virginian-Pilot". August 7, 2024. Archived from the original on October 15, 2012. Retrieved October 19, 2012.
  269. "Quinnipiac University". Archived from the original on August 19, 2012.
  270. "NBC News/Marist College" (PDF). Archived from the original (PDF) on October 5, 2012.
  271. Washington Post
  272. 1 2 "Public Policy Polling" (PDF).
  273. "Romney opens lead over Obama but faces enthusiasm gap; Kaine trails Allen in Senate race - Roanoke College - Salem, Virginia". Archived from the original on April 11, 2012.
  274. "Rasmussen Reports/Pulse Opinion Research". Archived from the original on August 11, 2021.
  275. "Quinnipiac University". Archived from the original on March 20, 2012.
  276. "NBC News/Marist College" (PDF). Archived from the original (PDF) on October 22, 2012.
  277. "RC Poll: Allen leads Kaine in potential US Senate race; Republican hopefuls viewed negatively compared to Pres. Obama - Roanoke College - Salem, Virginia". Archived from the original on September 18, 2012.
  278. Richmond Times-Dispatch/Muhlenberg College/Christopher Newport University
  279. "Quinnipiac University". Archived from the original on September 13, 2012.
  280. "Poll Shows Presidential, Senate Races Deadlocked In Va. - Hotline On Call - Hotline On Call". January 30, 2012. Archived from the original on January 30, 2012.
  281. Moore Information
  282. "SurveyUSA Election Poll #19444". www.surveyusa.com.
  283. "Public Policy Polling" (PDF).
  284. "The Seattle Times | Local news, sports, business, politics, entertainment, travel, restaurants and opinion for Seattle and the Pacific Northwest". www.seattletimes.com.
  285. "SurveyUSA Election Poll #19221". www.surveyusa.com.
  286. "Public Policy Polling" (PDF).
  287. "SurveyUSA Election Poll #18989". www.surveyusa.com.
  288. "Survey finds state residents favoring Romney - News - Charleston Dai..." archive.ph. December 4, 2012. Archived from the original on December 4, 2012.
  289. "Statewide poll gives Romney big edge over Obama - News - Charleston ..." archive.ph. December 9, 2012. Archived from the original on December 9, 2012.
  290. "Marquette Law School" (PDF).
  291. "Public Policy Polling" (PDF).
  292. 1 2 3 4 5 6 "Election 2012: Wisconsin President". www.rasmussenreports.com.
  293. "CNN/Opinion Research Corporation" (PDF).
  294. "Marquette Law School Poll finds tightening of GOP Senate primary – Marquette Law School Poll". August 22, 2018.
  295. "Marquette Law School Poll finds tighter U.S. Senate race and GOP primary – Marquette Law School Poll". October 12, 2022.
  296. "Public Policy Polling" (PDF).
  297. "Marquette Law School Poll finds Thompson leading U.S. Senate Race – Marquette Law School Poll". April 10, 2019.
  298. "Bellwether? | weaskamerica.com". June 7, 2012. Archived from the original on June 7, 2012.
  299. "Marquette Law School" (PDF).
  300. "St. Norbert College" (PDF).
  301. "Daily Kos/Public Policy Polling".
  302. "Marquette Law School Poll shows Walker, Kleefisch lead in recall – Marquette Law School Poll". October 31, 2018.
  303. "Marquette Law School Poll shows Barrett leads Falk in recall primary; Walker and Barrett within single percentage point – Marquette Law School Poll". June 26, 2024.
  304. "Daily Kos/Public Policy Polling".
  305. "NBC News/Marist College" (PDF). Archived from the original (PDF) on September 15, 2012.
  306. "Marquette Law School" (PDF).
  307. "Public Policy Polling" (PDF).
  308. "Marquette Law School" (PDF).
  309. "Walker and Obama have single digit leads in Marquette Law School Poll – Marquette Law School Poll". April 27, 2022.
  310. "Reason-Rupe" (PDF).

Related Research Articles

This article is a collection of statewide public opinion polls that have been conducted relating to the Super Tuesday Democratic presidential primaries, 2008.

This article is a collection of statewide public opinion polls that have been conducted relating to the April, May, and June Democratic presidential primaries, 2008.

<span class="mw-page-title-main">Statewide opinion polling for the 2012 United States presidential election</span>

Statewide public opinion polls that were conducted relating to the 2012 United States presidential election, which was won by incumbent President Barack Obama, are as follows. The polls show the status between Republican nominee Mitt Romney and President Obama. Also included are three- and four-way race polls with the Republican and Democratic nominees against various third party candidates.

<span class="mw-page-title-main">2012 United States Senate election in Florida</span>

The 2012 United States Senate election in Florida was held on November 6, 2012, alongside a presidential election, other elections to the House and Senate, as well as various state and local elections. The primary election was held August 14, 2012. Incumbent Senator Bill Nelson won reelection to a third term, defeating Republican U.S. Representative Connie Mack IV by 13%, winning 55% to 42%. Nelson defeated Mack by over 1 million votes.

<span class="mw-page-title-main">2012 United States Senate election in Ohio</span>

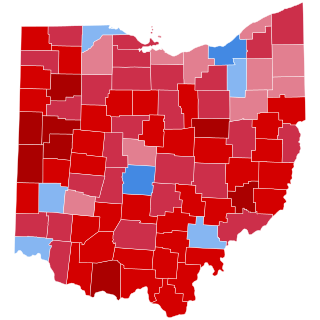
The 2012 United States Senate election in Ohio took place on November 6, 2012, concurrently with the 2012 U.S. presidential election as well as other elections to the United States Senate and House of Representatives and various state and local elections. Incumbent Democratic U.S. Senator Sherrod Brown won re-election to a second term, defeating Republican Josh Mandel, the Ohio State Treasurer. Brown was unopposed in the Democratic primary while Mandel won the Republican primary with 63% of the vote.

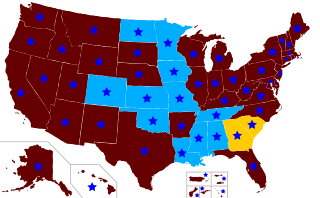
Nationwide public opinion polls conducted with respect to the Republican primaries for the 2012 United States presidential election are as follows. The people named in the polls were either declared candidates, former candidates or received media speculation about their possible candidacy.

<span class="mw-page-title-main">2012 United States presidential election in Connecticut</span>

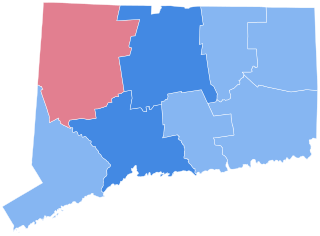
The 2012 United States presidential election in Connecticut took place on November 6, 2012, as part of the 2012 United States presidential election in which all 50 states plus the District of Columbia participated. Connecticut voters chose seven electors to represent them in the Electoral College via a popular vote pitting incumbent Democratic President Barack Obama and his running mate, Vice President Joe Biden, against Republican challenger and former Massachusetts Governor Mitt Romney and his running mate, Congressman Paul Ryan. Obama and Biden carried Connecticut with 58.1% of the popular vote to Romney's and Ryan's 40.7%, thus winning the state's seven electoral votes. Romney managed to flip the traditionally Republican Litchfield County, which Obama had won in 2008. As of the 2020 United States presidential election, this was the last election that the Democratic presidential nominee won Windham County.

Statewide polls for the 2012 United States presidential election are as follows. The polls listed here, by state, are from 2009 to December 31, 2011, and provide early data on opinion polling between a possible Republican candidate against incumbent President Barack Obama.

This is a list of nationwide public opinion polls that were conducted relating to the Republican primaries for the 2016 United States presidential election. The persons named in the polls were either declared candidates, former candidates, or received media speculation about their possible candidacy. On May 4, 2016, Donald Trump became the sole contender and presumptive nominee.

<span class="mw-page-title-main">Statewide opinion polling for the 2016 Republican Party presidential primaries</span>

This article contains opinion polling by U.S. state for the 2016 Republican Party presidential primaries. The shading for each poll indicates the candidate(s) which are within one margin of error of the poll's leader.

<span class="mw-page-title-main">Statewide opinion polling for the 2016 Democratic Party presidential primaries</span>

This article contains opinion polling by U.S. state for the 2016 Democratic Party presidential primaries. For currency and accuracy, please note the specific dates for each polling as listed below. For the significance of the earliest state votes, the Iowa caucuses and the New Hampshire primary, see United States presidential primary – Iowa and New Hampshire. To know when any given state votes, see the timeline of primaries and caucuses.

<span class="mw-page-title-main">Statewide opinion polling for the 2016 United States presidential election</span>

Statewide polls for the 2016 United States presidential election include the following. The polls listed here provide early data on opinion polling between the Democratic candidate, the Republican candidate, the Libertarian candidate, and the Green candidate. Prior to the parties' conventions, presumptive candidates were included in the polls. State polling is not conducted in all states for the election due to various factors. More polls usually are conducted in states that are considered swing states as more attention is given to the results. For determining a statistical tie, the margin of error provided by the polling source is applied to the result for each candidate.

<span class="mw-page-title-main">Statewide opinion polling for the April 2012 Republican Party presidential primaries</span>

This article contains opinion polling by U.S. state for the 2012 Republican Party presidential primaries.

<span class="mw-page-title-main">Statewide opinion polling for the March 2012 Republican Party presidential primaries</span>

This article contains opinion polling by U.S. state for the 2012 Republican Party presidential primaries.

Statewide polls for the 2016 United States presidential election are as follows. The polls listed here, by state, are from 2013 to December 31, 2015, and provide early data on opinion polling between a possible Republican candidate against a possible Democratic candidate.

Statewide polls for the 2016 United States presidential election are as follows. The polls listed here, by state, are from January 1 to August 31, 2016, and provide early data on opinion polling between a possible Republican candidate against a possible Democratic candidate.

<span class="mw-page-title-main">2020 United States presidential election in California</span>

The 2020 United States presidential election in California was held on Tuesday, November 3, 2020, as part of the 2020 United States presidential election in which all 50 states plus the District of Columbia participated. California voters chose electors to represent them in the Electoral College via a popular vote, pitting the Republican Party's nominee, incumbent President Donald Trump, and running mate Vice President Mike Pence against Democratic Party nominee, former Vice President Joe Biden, and his running mate Kamala Harris, the junior senator from California. In the 2020 election, California had 55 electoral votes in the Electoral College, the most of any state. Biden won by a wide margin, as was expected; however, California was one of six states where Trump received a larger percentage of the two-party vote than he did in 2016. This election also marked the first time since 2004 that the Republican candidate won more than one million votes in Los Angeles County due to increased turnout.

<span class="mw-page-title-main">2020 United States presidential election in Ohio</span>

The 2020 United States presidential election in Ohio was held on Tuesday, November 3, 2020, as part of the 2020 United States presidential election in which all 50 states plus the District of Columbia participated. Ohio voters chose electors to represent them in the Electoral College via a popular vote, pitting the Democratic Party nominee, former Vice President Joe Biden and his running mate, California Senator Kamala Harris against the Republican Party's nominee—incumbent President Donald Trump and his running mate, Vice President Mike Pence. Ohio had 18 electoral votes in the Electoral College.

<span class="mw-page-title-main">2020 United States presidential election in North Carolina</span>

The 2020 United States presidential election in North Carolina was held on Tuesday, November 3, 2020, as part of the 2020 United States presidential election in which all 50 states plus the District of Columbia participated. North Carolina voters chose electors to represent them in the Electoral College via a popular vote. The state was narrowly won by the Republican Party's nominee, incumbent President Donald Trump of Florida, and running mate Vice President Mike Pence of Indiana, against Democratic Party nominee, former Vice President Joe Biden of Delaware, and his running mate California Senator Kamala Harris. North Carolina had 15 electoral votes in the Electoral College.

<span class="mw-page-title-main">Statewide opinion polling for the 2020 United States presidential election</span>

This is a list of statewide public opinion polls that have been conducted relating to the 2020 United States presidential election. The persons named in the polls were declared candidates or received media speculation about their possible candidacy.