

Abstract
Neurons of the cerebellar nuclei have basal firing rates of 10–20 Hz, despite the convergence of many GABAergic Purkinje terminals onto cerebellar nuclear somata and the high spontaneous firing rate of Purkinje neurons. This persistence of firing during a constant barrage of inhibition raises the question of what patterns of Purkinje cell input inhibit nuclear cells most effectively. To explore the hypothesis that synaptic depression moderates inhibition at this synapse, we made whole-cell recordings from cerebellar nuclear neurons in mouse brain slices. IPSCs and IPSPs were elicited by electrically stimulating the corticonuclear tract at 10, 50, and 100 Hz. IPSCs evoked at the mean spontaneous firing rate of Purkinje cells (50 Hz) depressed by ∼60%. The onset of depression had a fast, frequency-dependent component, from which recovery was rapid (∼100 msec), and a slower, frequency-independent component, from which recovery was slow (∼10 sec). As stimulation rate increased, steady-state depression increased, but each IPSC decayed less completely between stimuli, producing a “tonic” IPSC. Changes in stimulation rate produced rapid changes in the level of depression. Under current clamp, cerebellar nuclear neurons fired spontaneously. During 50 Hz trains of IPSPs, firing was initially interrupted, but resumed coincident with the onset of depression. Low-frequency trains entrained postsynaptic firing, and high-frequency trains greatly slowed firing, primarily because of the tonic IPSC. Thus, the properties of depression at this synapse appear to limit the sensitivity of nuclear cells to basal inhibition, while allowing the cells to respond to increases and decreases in Purkinje cell activity.
Keywords: deep cerebellar nuclei, GABAA, spontaneous activity, short-term plasticity, frequency-dependence, IPSC, paired-pulse depression, interpositus
As the primary targets of Purkinje cells, neurons of the cerebellar nuclei receive a massive GABAergic input. Purkinje terminals ramify extensively within the nuclei, giving rise to several thousand synaptic boutons (Palkovits et al., 1977;Teune et al., 1998), and at least 30 Purkinje cells converge onto each cerebellar nuclear neuron (Chan-Palay, 1977). Because Purkinje cells have basal firing rates near 50 Hz (Granit and Phillips, 1956; Thach, 1968; Hounsgaard, 1979; Llinás and Sugimori, 1980), each nuclear neuron potentially receives thousands of IPSPs each second.
When all synaptic inputs are removed or blocked, cerebellar nuclear neurons fire spontaneously at 10–20 Hz (Jahnsen, 1986a; Llinás and Mühlethaler, 1988; Mouginot and Gähwiler, 1995;Aizenman and Linden, 1999; Raman et al., 2000). Given the predicted level of basal inhibition in vivo, it is remarkable that cerebellar nuclear neurons fire at all, yet spike rates of 10–20 Hz are observed in vivo in resting animals (Thach, 1968;McDevitt et al., 1987; LeDoux et al., 1998). Thus, cerebellar nuclear neurons appear relatively insensitive to individual inhibitory inputs under resting conditions. Indeed, recordings in vivo from synaptically connected pairs of Purkinje and nuclear neurons reveal no significant correlation during spontaneous firing (McDevitt et al., 1987). These observations raise the question of how, during cerebellum-dependent behaviors, Purkinje cells control the activity of nuclear neurons, when in the resting state the nuclear neurons seem unresponsive even to high levels of Purkinje cell input.
Several factors may contribute to the persistence of basal cerebellar nuclear activity. First, intrinsic conductances of nuclear neurons appear adapted to promote firing during small hyperpolarizations and to restore firing after large hyperpolarizations (Llinás and Mühlethaler, 1988; Aizenman and Linden, 1999; Raman et al., 2000;Gauck et al., 2001). Second, the excitatory inputs onto nuclear cells have unusual properties, including weak Mg2+ block of NMDA receptors (Anchisi et al., 2001) and activity-dependent potentiation of postsynaptic excitability (Aizenman and Linden, 2000), although little is known about the resting excitatory drive to nuclear neurons. Third, the basal inhibition received by cerebellar nuclear neurons may be limited by short-term synaptic dynamics. Specifically, the inhibition of each nuclear neuron might be reduced if spontaneously firing Purkinje terminals were strongly depressed. Changes in presynaptic firing frequency, then, could promote either depression or recovery of IPSCs, and the resulting changes in synaptic strength might serve to regulate firing of cerebellar nuclear cells.
To explore this hypothesis, we measured the activity dependence of the strength of inhibition at the Purkinje-to-nuclear cell synapse in mouse brain slices. We have found that spontaneous activity of Purkinje cells is likely to produce a significant synaptic depression, which may permit the persistence of cerebellar nuclear firing during basal inhibition. The kinetics of depression allow decreases in presynaptic activity to elicit larger, recovered IPSCs that can regulate spike timing, and increases in presynaptic activity to evoke smaller, depressed IPSCs that sum to form an effective hyperpolarizing shunt. Thus, although cerebellar nuclear neurons respond moderately to spontaneous inhibition, they can transduce lower- and higher-frequency signals from Purkinje cells.
MATERIALS AND METHODS
Preparation of tissue. C57BL6 mice (13- to 15-d-old; Charles River Laboratories, Wilmington, MA) were deeply anesthetized with halothane, in accordance with institutional guidelines, and transcardially perfused with Tyrode's solution at 4°C containing (in mm): 123.75 NaCl, 3.5 KCl, 26 NaHCO3, 1.25 NaH2PO4, 1 MgCl2, 2 CaCl2, and 10 glucose, oxygenated with 95% O2 and 5% CO2. Animals were decapitated, and the cerebella were removed. Parasagittal cerebellar slices (300 μm) were cut in Tyrode's solution at 4°C on a vibratome (model VT 100S; Leica, Deerfield, IL) and then were incubated for 1 hr at 34°C in oxygenated Tyrode's solution before they were used for recording.
In pilot experiments, axons were labeled to assess the integrity of corticonuclear projections. DiI crystals were placed on the surface of parasagittal slices, and the labeled axons were viewed with standard fluorescence microscopy (Optiphot; Nikon, Tokyo, Japan). Crystals placed on the Purkinje cell layer revealed that most of the labeled axons projecting out of the cerebellar cortex exited the slice before reaching the cerebellar nuclei. Crystals placed directly in the corticonuclear tract, however, labeled many axons that entered and appeared to terminate in the cerebellar nuclei. Because slices containing the most medial portions of the cerebellar nuclei had the greatest density of afferent axons, these slices were selected for electrophysiological recordings.
Electrophysiological recording. Neurons in the cerebellar nuclei were visualized directly using infrared differential interference contrast microscopy on a Zeiss fixed stage microscope. Slices were superfused with oxygenated Tyrode's solution at 31°C to which 6,7-dinitroquinoxaline-2,3-dione (DNQX; 5 μm) and (RS)-3-(2-carboxypiperazin-4-yl)-propyl-1-phosphonic acid (CPP; 10 μm) had been added to block AMPA and NMDA receptors. SR95531, (S)-α-methyl-4-carboxyphenylglycine (MCPG) and tetrodotoxin (TTX) were added to the superfusion solution as indicated.
Recordings were made from medium to large neurons (15–20 μm somatic diameter), which are thought to correspond to the glutamatergic projection neurons of the cerebellar nuclei (Monaghan et al., 1986). Recording pipettes of 1–4 MΩ were pulled on a P97 puller (Sutter, Novato, CA) from borosilicate glass (AM Systems, Carlsborg, WA). Pipettes were filled with a solution containing (in mm): 119 K-gluconate, 2 Na-gluconate, 6 NaCl, 2 MgCl2, 10 EGTA, 10 HEPES, 14 Tris-creatine phosphate, 4 MgATP, and 0.3 Tris GTP, buffered to pH 7.3, with KOH. For voltage-clamp recordings, 10 TEA Cl and 0.6 QX314-Br were added to the intracellular solution to reduce postsynaptic K currents, Na currents, and GABAB-mediated currents. Drugs were obtained from Sigma-Aldrich (St. Louis, MO), except DNQX, CPP, MCPG, SR95531 (Tocris Cookson, Baldwin, MO) and TTX (Alomone Labs, Jerusalem, Israel). Data were recorded with an Axopatch 200B amplifier, in V-clamp or I-fast mode, and pClamp software (Axon Instruments, Union City, CA). Data were sampled at 20 kHz and filtered at 5 kHz. Series resistance was routinely compensated by 80%. For all voltage-clamp recordings, cells were held at −40 mV (corrected for a 10 mV junction potential).
IPSCs were evoked with 100 μsec voltage pulses delivered through a concentric bipolar stimulating electrode (FHC, Bowdoinham, ME). The electrode was inserted in the corticonuclear tract at a level where pilot studies with DiI indicated a high density of axons that terminated in the cerebellar nuclei, but as far as possible from the nuclei themselves (>500 μm), to minimize activation of collaterals of the small inhibitory cerebellar nuclear neurons.
In many cells, the first few trains of high-frequency stimulation led to a potentiation of IPSC amplitude (Aizenman et al., 1998; Ouardouz and Sastry, 2000). We therefore applied three 1 sec, 100 Hz trains, after which IPSC amplitude stabilized, and then readjusted the stimulation intensity to produce IPSCs of ∼500 pA. All measurements were made after recordings had stabilized. Stimulus trains were applied at 20 sec intervals. This interval was chosen empirically as twice the shortest interval that allowed complete recovery from depression between trains. Recordings of train-evoked IPSCs were repeated at least 10 times and averaged to reduce the contribution of spontaneous events and to obtain an accurate measurement of IPSC amplitudes.
Analysis. Miniature IPSCs (recorded in TTX) and spontaneous IPSCs (recorded without TTX) were analyzed with MiniAnalysis (Synaptosoft, Decatur, GA). The frequency and amplitude of events >7 pA above baseline was measured from 1 min recordings. Other data were analyzed with IGOR Pro software (Wavemetrics, Lake Oswego, OR). IPSC amplitude was measured as the peak evoked synaptic current relative to the holding current preceding each train (see Fig.2B), as well as relative to the synaptic current preceding each stimulus (“foot-to-peak” or phasic IPSCs). For current-clamp data, instantaneous firing frequency was calculated for each action potential as the inverse of the previous interspike interval. Mean spike frequencies during inhibitory stimulus trains were calculated as the mean instantaneous firing frequency during each train (e.g., for 1 sec at 50 Hz), averaged over four to six repetitions of the train.
Fig. 2.

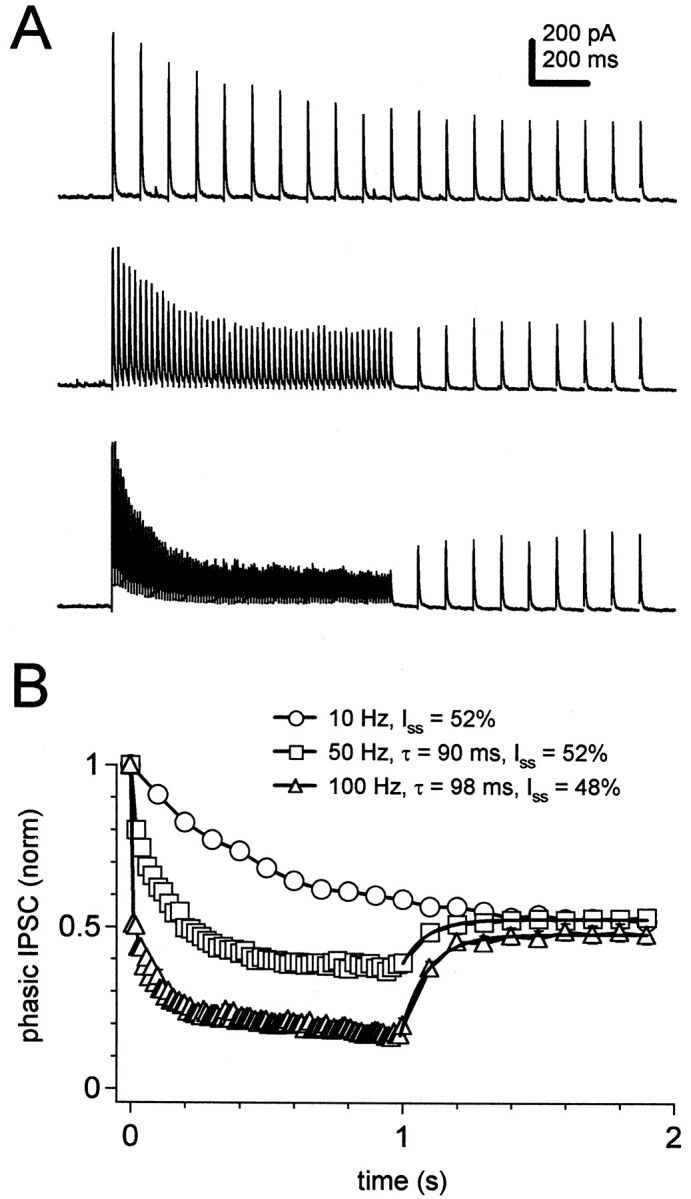
Depression of IPSCs evoked by stimulus trains.A, IPSCs evoked by 1 sec stimulus trains at 10, 50, and 100 Hz. Calibration applies to all traces. B, Mean peak amplitudes of evoked IPSCs, measured relative to the baseline holding current preceding stimulation and normalized to the first IPSC in each train versus time. N = 30, 31, and 30 cells for trains at 10, 50, and 100 Hz. Some standard error bars are within thesymbols in all graphs in all figures. C, Mean amplitudes of tonic IPSCs, measured just preceding each stimulus artifact versus time. Dashed line indicates 0 pA.D, Mean amplitudes of phasic IPSCs, measured relative to the tonic IPSC preceding each stimulus artifact and normalized to the first IPSC in each train versus time. Time scale also applies toB and C.
Stimulus artifacts have been digitally reduced in all figures of voltage-clamp recordings. Data are presented as mean ± SE. In most plots of data obtained with 100 Hz stimuli, SEs are shown only on every fifth symbol for clarity.
RESULTS
Evoked and spontaneous IPSCs in cerebellar nuclear neurons
In voltage-clamped cerebellar nuclear neurons, electrical stimulation of the corticonuclear tract in the presence of blockers of excitatory synaptic transmission elicited postsynaptic currents that were outward at −40 mV. As expected for GABAA-mediated IPSCs, the currents were completely blocked by the specific GABAAantagonist SR95531 (10 μm; N = 16) (Fig.1A). TTX (1 μm) fully blocked evoked IPSCs (N = 7; data not shown). Changing the stimulus intensity produced graded changes in the amplitude of evoked IPSCs in all cells, but the range of amplitudes varied across cells. Maximal stimulus intensities elicited currents as large as 3 nA (N = 3). In two cells, IPSCs as small as ∼250 pA could be reliably elicited. The lowest amplitude IPSC that could be reliably evoked in all cells was ∼500 pA. In all quantitative studies of train-evoked IPSCs, therefore, we adjusted the stimulus intensity to evoke a single IPSC of ∼500 pA.
Fig. 1.

Evoked and spontaneous IPSCs in cerebellar nuclear neurons. A, An IPSC evoked by stimulation of the corticonuclear tract (top, average of 30 traces) and its blockade by 10 μm SR95531 (bottom, average of 10 traces). Arrow indicates time of stimulation. Holding potential, −40 mV. B, A 7 sec recording of sIPSCs including small and large amplitude events (different cell).C, Amplitude histogram of sIPSCs (control) and mIPSCs (TTX). Bin width, 5 pA.
Because each nuclear cell receives input from tens of Purkinje cells, we wished to estimate how many fibers were activated to elicit these 500 pA IPSCs. Doing so requires estimating the size of an IPSC resulting from a single action potential in a single Purkinje afferent axon. We therefore examined the spontaneous IPSCs (sIPSCs) that were evident in most recordings. Because Purkinje neurons account for 85% of the somatic synapses and 50% of the dendritic synapses onto nuclear neurons, many of these events are likely to arise from Purkinje terminals (Chan-Palay, 1977). Fifteen percent of the somatic innervation and 25% of the dendritic innervation of large cerebellar nuclear neurons, however, comes from local collaterals of the small inhibitory cerebellar nuclear neurons (Chan-Palay, 1977). These inhibitory neurons stain for both GABA and glycine (Chen and Hillman, 1993; Bäurle and Grüsser-Cornehls, 1997). Like the evoked IPSCs, the sIPSCs that we recorded were fully blocked by 10 μm SR95531 (N = 16). This result is consistent with their being GABAAreceptor-mediated currents rather than the mixed inhibitory currents predicted for the local nuclear neurons, although we cannot exclude the possibility that some inhibitory nuclear neurons release only GABA. Considering the dominance of Purkinje cell innervation and the pharmacology of the events, we analyzed the amplitude distributions of the sIPSCs, on the assumption that the majority of events resulted from action potentials in individual Purkinje axons.
The amplitudes of sIPSCs ranged from our detection threshold (7–10 pA) to 449 pA (Fig. 1B) (N = 17). In the presence of 1 μm TTX, 98.5 ± 3.5% of the miniature IPSCs (mIPSCs) were smaller than 30 pA (Fig. 1C). The mean mIPSC amplitude was 14.8 ± 1.7 pA (N = 8; 1500–2500 events per cell); given an empirically determined reversal potential of −61 ± 4 mV (N = 19), this corresponds to a mean miniature conductance of ∼750 pS. The amplitudes of TTX-sensitive events ranged from ∼25 pA (i.e., just larger than the miniature events) to a few hundred picoamperes (Fig.1C). Although sIPSCs >250 pA were observed in three neurons, in the other 14 cells tested, the largest sIPSCs were <150 pA (mean, 71 ± 31 pA). Across cells, the majority of the action potential-driven events were between 50 and 100 pA, or ∼3–7 times a mIPSC. Thus, despite the high density of anatomically identified Purkinje cell synapses, an action potential in a single Purkinje cell may evoke an IPSC with only a moderate quantal content. Furthermore, although it is possible that the evoked IPSCs of 500 pA could result from activation of as few as 2 or as many as 20 Purkinje afferents, on average they probably resulted from stimulation of 5–10 fibers.
The frequency of sIPSCs ranged from 7 to 70 Hz, considerably lower than predicted from tens of converging Purkinje neurons each firing at 50 Hz. Although maximal firing rates develop only by postnatal day 20, Purkinje neurons at postnatal day 13 (P13) to P15 already exhibit robust spontaneous firing at tens of Hertz (Crépel, 1972; our unpublished observations). A lack of Purkinje cell activity, therefore, was probably not responsible for the low frequency of sIPSCs, although it is possible that there may be many failures of transmitter release. A likely explanation for the relatively low level of spontaneous synaptic activity, however, is that many of the superficial Purkinje axons were cut during the slicing process, as indicated by pilot experiments with DiI (Materials and Methods). Thus, although the Purkinje cell bodies fire regular spontaneous action potentials in the slice (Häusser and Clark, 1997), the axons are unlikely to do so when severed from their somata, limiting the action potential-dependent release of transmitter onto nuclear neurons. This axonal cutting is advantageous, because it allows experimental control over the firing rate of Purkinje axons, and it limits the number of Purkinje terminals whose synaptic strength may have been modulated by activity preceding stimulation.
Depression of IPSCs evoked at different frequencies
Because Purkinje neurons in vivo are rarely silent, it is likely that the Purkinje-to-nuclear cell synapse operates under some level of facilitation or depression as a consequence of ongoing activity. Therefore, having confirmed that we could reliably stimulate a moderate number of Purkinje axons, we examined the activity dependence of inhibition by eliciting IPSCs at different stimulation frequencies. At least 10 recordings were averaged to obtain an accurate measure of IPSC amplitudes evoked by stimulus trains and to minimize contamination by sIPSCs. One second trains of stimuli at 10, 50, and 100 Hz all evoked IPSCs that depressed during the trains (N = 30) (Fig.2A); facilitation was never observed. Mean IPSC peaks, measured relative to the holding current preceding the train, were normalized to the amplitude of the first IPSC and are plotted in Figure 2B for all three frequencies of stimulation (N = 30). At the end of the 1 sec stimulation, the IPSCs evoked at 10 Hz had depressed by 40 ± 2%. This steady-state depression was more pronounced at higher stimulation frequencies; at 50 Hz, peak IPSCs depressed by 58 ± 2%, and at 100 Hz, by 69 ± 2%. Because a subset of the axons that we stimulated may have been depressed by previous activity, the actual extent of depression induced by trains may be slightly greater than we measured.
At stimulation frequencies of 50 and 100 Hz, the synaptic current did not always decay fully between stimuli. Consequently, each successive IPSC was evoked on a baseline of synaptic current. Amplitudes of this “tonic” IPSC, measured just preceding the stimulation artifact, are shown in Figure 2C. Stimulating at 50 Hz led to a relatively small steady-state tonic IPSC of 29 ± 6 pA. At 100 Hz, however, this tonic IPSC was 91 ± 13 pA, ∼16% of the peak amplitude of the first IPSC (552 ± 55 pA).
These incomplete decays indicate that the depression of individual IPSCs at higher frequencies was greater than indicated by measurements of peak IPSC amplitude relative to the preceding baseline. Subtracting the tonic IPSC from the total peak IPSC gave a measure of the “foot-to-peak” or “phasic” IPSC amplitudes. This measure of IPSCs was used in all subsequent voltage-clamp experiments. Normalized phasic IPSC amplitudes are plotted in Figure 2D for all three frequencies tested. After 1 sec, phasic IPSCs depressed by 40 ± 1% during 10 Hz stimulation, by 61 ± 2% with 50 Hz stimulation, and by 83 ± 2% with 100 Hz stimulation.
Our estimates of depression might be exaggerated if Purkinje axons could not follow the electrical stimulation, particularly at the highest frequencies. In fact, in a few recordings, some stimuli in the 100 Hz train evoked no IPSCs; these data were not included in any quantitative analyses. Errors in estimating synaptic depression might also arise if axons that were successfully activated early in the stimulus train were to fail later in the train. If this were the case, increasing the stimulus intensity would be likely to minimize the stimulus failure late in the train and thereby decrease the apparent extent of depression. When we modulated the stimulus strength, however, we observed a similar profile of depression with either increases (Fig.3A, left panels) or decreases (Fig. 3A, right panels) in stimulus intensity, as long as each stimulus evoked a measurable IPSC. The consistent decrement in IPSC amplitudes across stimulus intensities suggests that the depression that we measured is unlikely to be a consequence of stimulus failure.
Fig. 3.
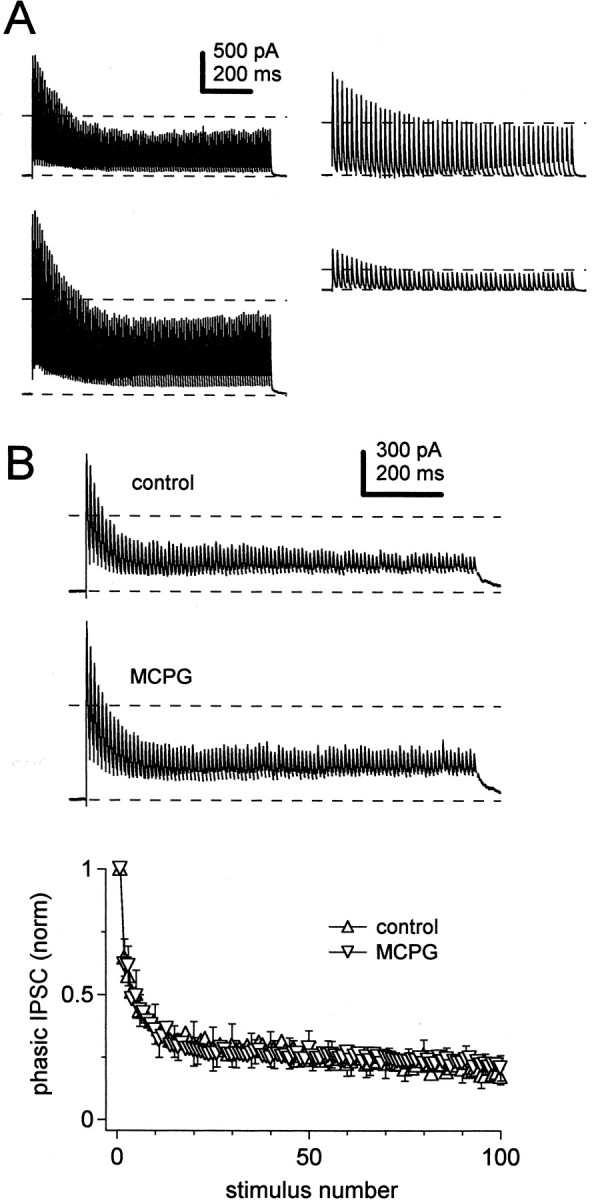
Persistence of IPSC depression during changes in stimulus intensity and blockade of metabotropic glutamate receptors.A, IPSCs evoked by 1 sec stimulus trains at different stimulus intensities. The profile of depression was constant when the stimulus intensity was increased (left panels, 100 Hz) or decreased (right panels, 50 Hz, different cell). Calibration applies to all panels. Dashed lines on each trace indicate prestimulus baseline current and 50% of the peak amplitude of the first IPSC.B,Top panels, IPSCs evoked in one cell by 1 sec, 100 Hz trains in control (top trace) and in solutions containing 500 μm MCPG (bottom trace). Calibration applies to both traces. Dashed lines as in A. Bottom panel, Mean amplitudes of IPSCs normalized to the first IPSC in each train versus stimulus number, for control (upright triangles) and MCPG (inverted triangles) conditions (N = 3). For clarity, standard error bars, which are shown on every fifth symbol, start on the second symbol for the control and the third symbol for MCPG condition.
Another potential source of error in our estimates of depression might result from actions of glutamate released by mossy fibers, which are also activated by high-frequency electrical stimulation (Aizenman and Linden, 2000; Anchisi et al., 2001). Although ionotropic glutamate receptors were always blocked by DNQX and CPP in our experiments, it is possible that glutamate from mossy fibers might reach metabotropic glutamate receptors (mGluRs) on Purkinje axon terminals. Such mGluR activation might reduce GABA release, leading us to overestimate the synaptic depression resulting from endogenous Purkinje cell activity. To test this possibility, we recorded IPSCs evoked at 100 Hz in control solutions, as well as in solutions including the nonselective mGluR antagonist MCPG (500 μm). In three cells, the amplitude of the first IPSC in MCPG changed to 97, 130, and 240% of control. The mean change in amplitude was not significant (p= 0.25, paired t test), although the individual values suggest that ongoing, unevoked glutamate release in the slice may tonically activate mGluR receptors at some Purkinje-to-nuclear synapses (Fig. 3B, top two panels). Regardless of any modulation of the first IPSC, the onset and extent of depression were indistinguishable in control and MCPG-containing solutions (Fig.3B, bottom panel). In the steady state, IPSCs evoked at 100 Hz depressed by 83 ± 5% in control and 79 ± 9% in MCPG (N = 3; p = 0.2, paired t test). These results suggest that the synaptic depression that we measure in response to stimulus trains is likely to reflect intrinsic properties of GABAergic transmission at the Purkinje-to-nuclear cell synapse. In subsequent experiments, MCPG was omitted from the bath solution.
Multiple phases of depression
Inspection of the data in Figure 2D reveals that the onset of depression occurs in multiple phases. To emphasize this point, the data of Figure 2D are replotted against stimulus number in Figure4A. A significant amount of depression appears to be induced rapidly by the first stimulus. This paired-pulse depression, given as [1 − (IPSC2/IPSC1)], was 51 ± 4% at 100 Hz, 21 ± 3% at 50 Hz, and 9 ± 1% at 10 Hz. In contrast to the paired-pulse depression, which varied considerably with stimulus frequency, the onset of depression during the next 15–20 stimuli was relatively frequency-independent. This slow, second phase of depression is illustrated in Figure4B, in which the individual IPSC amplitudes are normalized to the second IPSC in the train and plotted against stimulus number. Only toward the twentieth stimulus do the IPSCs evoked at 100 Hz diverge slightly from those evoked at 10 or 50 Hz. Continued stimulation at 50 and 100 Hz induced a third phase of depression, which was slower than the previous phases and which appeared to be frequency-dependent (Fig. 4A). Exponential fits to the second through last IPSC show a dominant time constant of depression of ∼5 stimuli across stimulus frequencies, corresponding to the second phase of depression, and a minor time constant of 9.5 stimuli at 50 Hz or 117 stimuli at 100 Hz (Fig. 4A). The longer time constants may be somewhat underestimated, however, because depression does not always reach a steady state after 1 sec.
Fig. 4.

Multiple phases of depression. A, Phasic IPSC amplitudes from Figure 2B versus stimulus number. This plot includes only the 25 cells in which the 10 Hz stimulation was given for 2 sec. Data are fitted with a single (10 Hz) or double exponential decay (50, 100 Hz; thick black lines). Decay constants (in stimuli, τ) and percent steady-state current (IPSCss) are indicated on the plot. For the 50 and 100 Hz train, the percentage of contribution of the briefer decay time constant is given in parentheses.B, Same data as in A, but normalized to the second IPSC in each train versus stimulus number for the first 50 stimuli. Error bars not included. C, Fast recovery from depression. Fractional recovery from depression induced by a single stimulus (IPSC2/IPSC1,filled symbols) and from depression induced by a 1 sec, 50 Hz train (IPSC50/IPSC1,open symbols) versus interval. Recovery following the train is 43, 49, and 54% of recovery after the single stimulus.
Thus, a large fraction of the total depression of phasic IPSCs occurs within one stimulus. The strong frequency dependence indicates that recovery is quite fast. In Figure 4C, the ratio of IPSC2 to IPSC1 is replotted against stimulus interval (filled symbols), illustrating that recovery from paired-pulse depression has a time constant between 20 and 50 msec. To compare this time course to the rate of recovery from the slower phases of depression, test IPSCs were measured at 10, 20, and 100 msec intervals after a 1 sec, 50 Hz train. A fast phase of recovery was again evident (to 49 ± 3% in 100 msec) (Fig. 4C, open symbols), although a second phase of recovery had a time constant of 8 sec (N = 2; data not shown). Complete recovery from depression induced by the 50 Hz train required 10 sec (see Materials and Methods). This result suggests distinct mechanisms for the onset of and recovery from the fast and slow phases of depression.
Changes in depression after modulation of stimulation frequencies
Given the high rates of firing of individual Purkinje neurons in the intact cerebellum, IPSCs might rarely, if ever, recover fully from the slow phases of depression, whereas the fast phase of recovery might readily occur. To test this idea, we applied a 1 sec conditioning train of presynaptic stimuli at 50 or 100 Hz, followed immediately by a 1 sec “recovery train” of stimuli at 10 Hz (Fig.5A). After the switch to the 10 Hz recovery train, IPSCs recovered rapidly, with time constants of <100 msec (one stimulus), to a steady-state amplitude of ∼50% of the initial IPSC (Fig. 5B). The same steady-state amplitude of IPSCs was reached during a 2 sec train at 10 Hz (Fig.5A,B). This result suggests that, when rapidly firing Purkinje afferents slow their activity, the IPSCs may quickly reach a new, larger, steady-state amplitude.
Fig. 5.
Recovery from depression after decreases in stimulation frequency. A, IPSCs evoked by 1 sec conditioning trains at 10, 50, and 100 Hz followed by a 1 sec, 10 Hz “recovery train.” Data from one cell. B, Mean phasic IPSC amplitudes, normalized to the first IPSC in the train, for data obtained as in A (N = 25). Data from the recovery trains after conditioning at 50 and 100 Hz are fit with single exponentials (thick black lines), and the time constants, τ, and steady-state IPSC as a percentage of the first IPSC, Iss, are indicated on the plot. The Iss for 10 Hz is given as the last IPSC in the 2 sec train as a percentage of the first.
We were especially interested in understanding how the synaptic depression induced by spontaneous firing of Purkinje neurons may regulate the efficacy of inhibition upon increases in Purkinje cell activity, such as those associated with cerebellum-dependent behaviors. We therefore recorded IPSCs evoked by a 50 Hz, 1 sec train of presynaptic stimuli followed immediately by a 100 Hz, 1 sec train (Fig.6A). During the 50 Hz stimulation, IPSCs reached a steady level of depression of 65 ± 2% (N = 25). At the onset of the 100 Hz train, depression increased abruptly, to 79 ± 2% within one stimulus. During the remainder of the 100 Hz train, IPSCs depressed slowly (τ = 441 msec), to a final level of 88 ± 2% depression (Fig. 6B), which corresponded to an amplitude of 71 ± 11 pA for the final phasic IPSC. These small steady-state IPSCs were superimposed on a relatively significant tonic IPSC, which was 91 ± 13 pA by the end of the 100 Hz train (Fig.6C). This value, which is similar to the tonic IPSC of 94 pA attained during a 100 Hz, 1 sec train with no preceding stimuli, suggests that much of the synaptic current evoked at high stimulation rates is represented to the cerebellar nuclear cell as a tonic IPSC. In conjunction with the previous data, these results illustrate that each presynaptic firing frequency is associated with a fixed, steady-state level of depression of IPSCs in cerebellar nuclear neurons. When the Purkinje firing frequency changes, the IPSC amplitude rapidly adjusts to the level of steady-state depression associated with the new firing frequency.
Fig. 6.

Changes in depression after increases in stimulation frequency. A,Top panel,IPSCs evoked by a 1 sec conditioning train at 50 Hz followed by a 1 sec, 100 Hz train. Data from one cell. Bottom panel,Expansion of the same trace, illustrating the switch from 50 to 100 Hz stimulation. Dashed line indicates holding current before stimulation. B, Mean phasic IPSC amplitudes for data obtained as in A (N = 25). Exponential fit to the data at 100 Hz (white line) has a time constant of 441 msec. C, Tonic IPSC amplitudes for data obtained as in A.
Effects of trains of IPSPs on the firing of cerebellar nuclear cells
These observations raise the question of which patterns of IPSCs are most effective at inhibiting the firing of cerebellar nuclear neurons. Low-frequency IPSCs are much larger than high-frequency IPSCs evoked from the same set of terminals, but high-frequency IPSCs have a greater potential for temporal summation. To test the efficacy of trains of IPSPs at inhibiting firing, we made current-clamp recordings from cerebellar nuclear neurons.
With excitation blocked, cerebellar nuclear neurons fired regular spontaneous trains of action potentials at 26 ± 6 Hz (N = 3), similar to rates reported in other studies (Jahnsen, 1986a; Mouginot and Gähwiler, 1995; Aizenman and Linden, 1999; Czubayko et al., 2001). Figure7A illustrates spontaneous action potentials recorded from a cerebellar nuclear neuron whose mean firing frequency was 18 Hz (left panel). The instantaneous firing frequency (the inverse of each interspike interval) is plotted against time of spike occurrence for several trials (right panel). Firing was regular, evident as a low coefficient of variation of the interspike interval (CV = 0.088 ± 0.016; N = 3). After adjusting the stimulation intensity under voltage-clamp to produce IPSCs comparable to those in our other experiments (∼500 pA at −40 mV), we tested the effect of 50 Hz trains of IPSPs on spontaneous firing. Early in the stimulus train, the evoked IPSPs generally interrupted cerebellar nuclear cell firing, although a tendency to depolarize toward threshold throughout the IPSPs was clear in many trials (Fig. 7B). Coincident with the onset of depression measured under voltage clamp, this depolarizing tendency appeared to outweigh the inhibition, and cerebellar nuclear cells resumed firing, although the rate was slowed relative to the spontaneous rate. During the first 25 stimuli of the 50 Hz train, the firing rate dropped to 51 ± 2% of the spontaneous rate, and the CV on the interspike interval increased to 0.49 ± 0.03 (N = 3) (Fig. 7C). During the next 25 stimuli, the firing rate was 56 ± 2% of the spontaneous rate, and the CV on the interspike interval was reduced to 0.28 ± 0.01 (N = 3) (Fig. 7C). An additional single IPSC evoked 500 msec after a 2 sec train also delayed the subsequent spike (Fig.7B, arrow, filled symbols), although firing immediately resumed. These results suggest that, although inhibition modifies the spontaneous firing pattern, the onset of depression of IPSCs can indeed facilitate the continued firing by cerebellar nuclear cells during basal inhibition from Purkinje neurons firing at 50 Hz.
Fig. 7.

Persistence of firing by cerebellar nuclear neurons during 50 Hz inhibitory trains. A,Left, Spontaneous firing of a cerebellar nuclear neuron with no holding current. Only the first 3 sec of a 5 sec record are shown. Right, Instantaneous firing frequency versus time. Six 5 sec trials from the same cell are superimposed to illustrate the stability of firing rate. B,Left, Firing during a 2 sec, 50 Hz train of evoked IPSPs. A single IPSP was evoked 500 msec after the train. Vertical artifacts indicate time of stimulation, and IPSPs are evident after the artifacts. Same cell as in A. Right,Instantaneous firing frequency versus time; seven superimposed trials.Solid line indicates duration of stimulus train.Arrow indicates time of the single stimulus applied after the train. The first IPSC after this stimulus is indicated as afilled circle, to illustrate replicability. Time scales also apply to A. C, Summary graphs of firing frequency (left) and the coefficient of variation of the interspike interval (CV of ISI) (right) during spontaneous firing (spont), during the first 25 stimuli at 50 Hz, and during the next 25 stimuli at 50 Hz (N = 3).
Trains of 10 Hz stimuli evoked IPSPs that did not abolish firing, but delayed each spike. This delay induced two of three cells to fire at ∼10 Hz (Fig. 8A), whereas a third cell, which had the highest spontaneous rate of the cells tested, fired doublets of action potentials at 10 Hz. An additional single IPSC evoked 1.5 sec after the 1 sec train also delayed the subsequent spike (Fig. 8A, bottom panel, arrow, filled symbols). These results suggest that relatively large-amplitude, low-frequency IPSPs may allow entrainment of cerebellar nuclear firing.
Fig. 8.
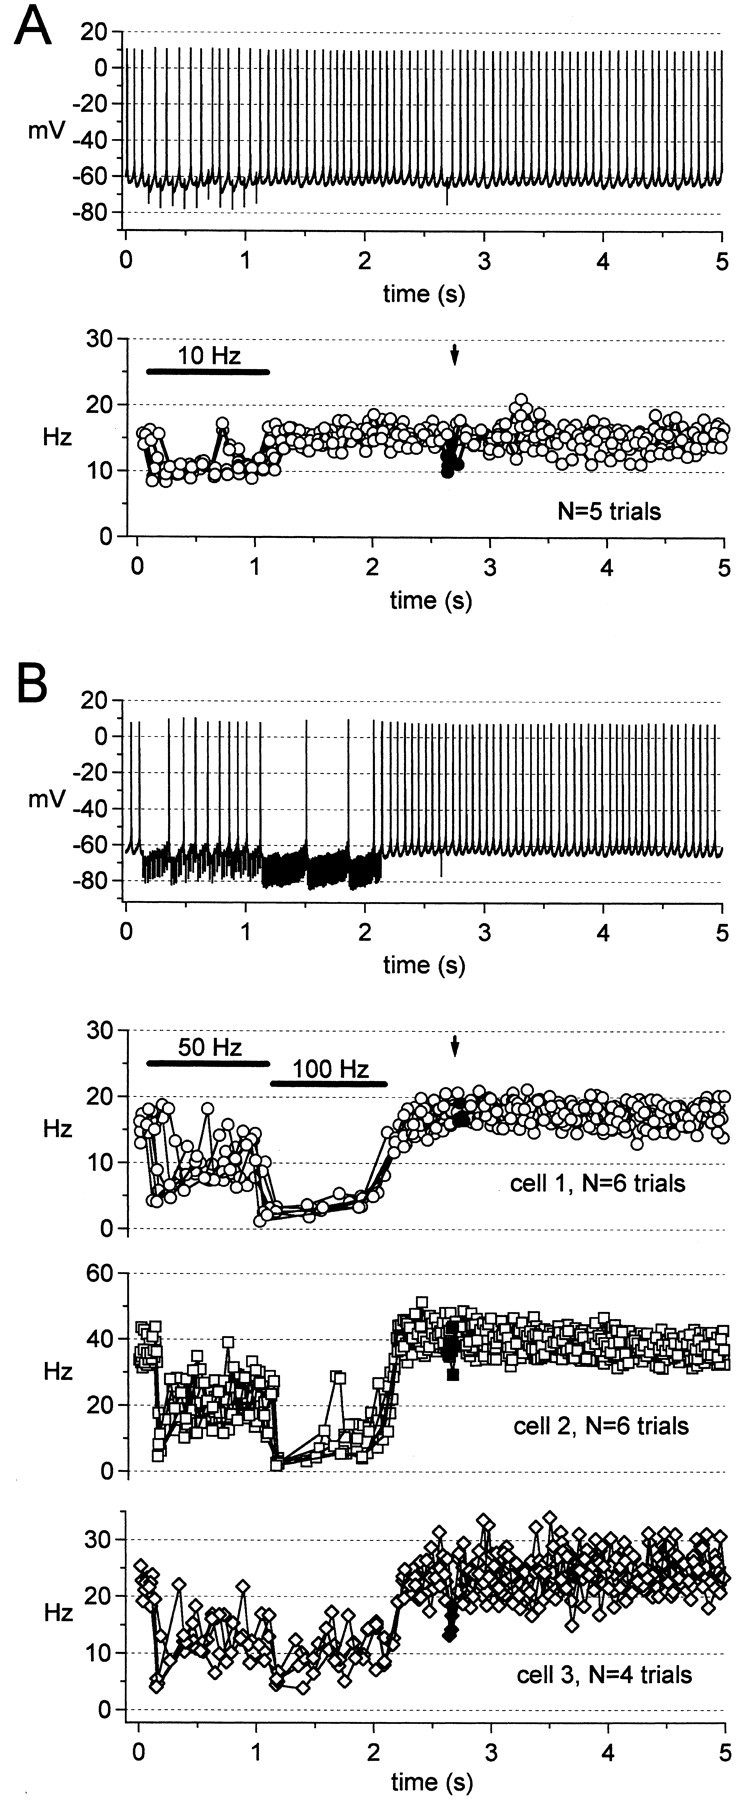
Regulation of firing of cerebellar nuclear neurons by trains of IPSPs. A,Top, Firing during a 1 sec, 10 Hz stimulus train. Same cell as Figure 7A.Bottom, Instantaneous frequency versus time; five superimposed trials; solid line and arrowas in Figure 7B. B,Top,Firing during a 1 sec, 50 Hz stimulus train followed by a 1 sec, 100 Hz train. Same cell as in Figure 7A. Bottom three panels, Instantaneous frequency versus time for three cells;cell 1 corresponds to the illustrated trace. The number of superimposed trials is indicated on each panel;solid line, arrow, and filled symbols as in Figure 7B.
When a 1 sec, 50 Hz train was followed directly by a 1 sec, 100 Hz train, the 100 Hz IPSPs further slowed the approach to threshold, interrupting firing by ∼250 msec (Fig. 8B,top panel). On average, the firing rate, which decreased from 26 ± 6 to 15 ± 3 Hz during the 50 Hz train, fell to 7.5 ± 2 Hz during the 100 Hz train (N = 3). Figure 8B (bottom panels) illustrates the individual responses of three neurons. When firing was interrupted by IPSPs, the membrane potential approached −68 mV, the predicted ECl for our current-clamp recording solutions (see Materials and Methods). This potential was not negative enough to elicit the robust rebound depolarizations that can be evoked by synaptic activation with ECl near −75 mV (Aizenman and Linden, 1998, 1999). Consequently, when synaptic stimulation ceased, firing immediately resumed at a rate equal to or slightly above the spontaneous rate, as observed in cerebellar slice cultures with ECl set near −70 mV (Mouginot and Gähwiler, 1995). Rebound depolarizations could be elicited in our experiments, however, by current injections to potentials more negative than −70 mV (data not shown), as in other Purkinje cell target neurons (Aizenman and Linden, 1998, 1999; Czubayko et al., 2001; Sekirnjak and du Lac, 2002).
The single IPSP evoked 500 msec after the 2 sec train produced no consistently detectable pause in firing in two of three cells (Fig.8B, arrow, filled symbols; compare with Fig. 7B). Thus, although synaptic depression by the preceding 100 Hz train apparently weakened inhibition by subsequent single IPSCs, the tonic IPSC during the train produced an effective shunt or hyperpolarization, making high-frequency stimulation able to exert a strong inhibitory effect on the firing of the postsynaptic cells.
DISCUSSION
The results show that inhibitory synaptic transmission between Purkinje and cerebellar nuclear neurons depresses across a range of physiological firing frequencies. Identifying the effective inhibitory signals at this synapse may have significant bearing on models of cerebellar function. For example, this synapse plays a central role in cerebellum-dependent classical conditioning (McCormick and Thompson, 1984; Raymond et al., 1996; Medina et al., 2002). Many aspects of this form of learning have been successfully described by models in which inhibition from Purkinje cells regulates plasticity of excitatory synapses onto nuclear cells (Medina and Mauk, 1999; Medina et al., 2001). Our data define the patterns of Purkinje activity that promote inhibition, thus controlling cerebellar output and possibly regulating cerebellar plasticity.
At the Purkinje-to-nuclear cell synapse, the steady-state amplitude of evoked postsynaptic currents varies indirectly with presynaptic stimulation rate (Abbott et al., 1997) and is quantitatively similar to that measured at other GABAergic synapses (Galarreta and Hestrin, 1998;Varela et al., 1999; Kraushaar and Jonas, 2000) (but see Gupta et al., 2000). Because the mean spontaneous firing rate of Purkinje neurons is near 50 Hz (Häusser and Clark, 1997; Raman and Bean, 1997), however, depression may be particularly significant at this synapse. Many Purkinje-to-nuclear cell contacts appear to have only moderate quantal contents, such that unitary IPSCs depressed by 50 Hz trains may be only a few times the mean mIPSC amplitude. Consequently, even stimulating ∼5–10 Purkinje axons synchronously at 50 Hz elicited IPSCs that depressed sufficiently to allow the postsynaptic nuclear cells to fire. By permitting cerebellar nuclear neurons to continue firing during high-frequency, but presumably asynchronous, basal inhibition (Thach, 1968; Mc Devitt et al., 1987), synaptic depression may keep postsynaptic neurons within their dynamic range. This adaptation to high-frequency inhibition in turn may set the stage for changes in Purkinje firing rate to silence or speed cerebellar output.
Influence of Purkinje cell inputs on cerebellar nuclear cell firing
If synaptic depression renders nuclear neurons relatively resistant to basal inhibition, effective inhibition of cerebellar nuclear neurons by Purkinje cells may require one of several conditions to be met. Possibly, nuclear cell firing can be silenced by synchronous activity in many (>10) Purkinje afferents. In our experiments, high-intensity stimulation of the corticonuclear tract at 50 Hz did prevent nuclear cell firing (data not shown), as demonstrated previously (Jahnsen, 1986b; Llinás and Mühlethaler, 1988;Mouginot and Gähwiler, 1995; Aizenman and Linden, 1999; Gauck and Jaeger, 2000). Thus, recruitment of fibers can apparently compensate for the depression of individual Purkinje terminals, although the extent to which such synchronization occurs under physiological conditions is unknown.
Alternatively, pauses in Purkinje cell firing may permit recovery from synaptic depression, such that a resumption of activity yields a more powerful inhibition. Our experiments have identified two phases of recovery from depression. The characteristics of fast recovery suggest that, as the stimulation frequency changes, the IPSC amplitude can rapidly switch from one level of steady-state depression to another. Under our recording conditions, transitions from 50 to 10 Hz stimulation of afferents produced a 10–15% recovery of IPSCs. Under current clamp, the most notable effect of these recovered IPSPs was that they delayed postsynaptic spikes; when they occurred at regular intervals just longer than the interspike interval, they entrained firing of the postsynaptic cell.
Given the high rates of firing in Purkinje cells, the characteristics of slow recovery suggest that the synapses may generally operate at about half their maximal strength. Interruptions of Purkinje cell activity on the order of a few hundred milliseconds, however, may permit partial recovery from the slow phases of synaptic depression. This possibility is intriguing, given the pauses in firing that often follow climbing fiber-initiated complex spikes (Schmolesky et al., 2002), particularly if these pauses can be synchronized across Purkinje afferents (Lang et al., 1999).
A third mechanism for effective inhibition of nuclear cells might involve Purkinje cell activity above the spontaneous rate, as often occurs at the onset of cerebellum-dependent movements (Thach, 1968;Gilbert and Thach, 1977; Thier et al., 2000). The claim that high-frequency firing promotes effective transmission is intuitively acceptable and is incorporated into many models of cerebellar function (Raymond et al., 1996; Medina et al., 2002). It has been observed, however, that Purkinje and cerebellar nuclear cell firing sometimes increase in parallel (Thach et al., 1992; Shinoda et al., 1997), suggestive of strong excitatory inputs to nuclear neurons, or of a decrease in inhibition at Purkinje-to-nuclear synapses. Our observation that depression of phasic IPSCs increased with firing rate initially called into question whether the highest-frequency IPSCs could exert a powerful postsynaptic effect. It was significant, therefore, that tonic synaptic current from incomplete decay of the phasic IPSCs also increased with firing rate and that 100 Hz IPSPs did slow firing significantly. Thus, although the depression of phasic IPSCs appears to be an important factor in permitting nuclear cell firing during 50 Hz trains, the effect of this depression is offset by a tonic IPSC at higher stimulus rates.
The ability of the ∼100 pA (∼5 nS) tonic IPSC to reduce firing may be facilitated by the low density of intrinsic currents active at subthreshold voltages in cerebellar nuclear neurons (Raman et al., 2000). This characteristic may allow even small changes in the balance of inward and outward currents to modify the rate and regularity of the endogenous firing pattern (Aizenman and Linden, 2000). Dynamic clamp studies of cerebellar nuclear neurons support this idea, showing that simulated synaptic conductances induce irregular firing patterns, and that changes in the amplitude of the total (excitatory plus inhibitory) conductance can modify spike timing (Gauck and Jaeger, 2000). Our data place quantitative constraints on how synchrony and gain of synaptic inhibition are regulated by depression of phasic IPSCs and accumulation of a tonic IPSC. By defining the parameters of effective synaptic inhibition at the Purkinje to nuclear synapse, these data may contribute to refining predictive models of cerebellar function.
Mechanisms of synaptic depression and recovery
Our experiments were directed toward identifying physiological effects of depression on signaling at the Purkinje-to-nuclear cell synapse and did not directly address how depression occurs. Several mechanisms may interact to produce the observed profile of depression. On the presynaptic side, the initially strong paired-pulse depression, which recovers almost fully in 100 msec, is qualitatively consistent with depletion of an immediately releasable pool that is rapidly replenished from a readily releasable pool. The second, slow phase of activity-independent depression may reflect the depletion of a readily releasable, slowly refilling pool (Zucker and Regehr, 2002). As at other synapses, some underlying facilitation may shape the release probability, and presynaptic calcium may also regulate the time course of recovery (Wang and Kaczmarek, 1998; Dittman et al., 2000; Sakaba and Neher, 2001).
Depression may also involve postsynaptic mechanisms, namely saturation and/or desensitization of GABAA receptors. For example, if the first IPSC were to saturate postsynaptic receptors, then a lack of available receptors might limit the response to the second stimulus at the shortest intervals, contributing to the first phase of depression. Evidence both in favor of and against saturation exists and may vary across synapses (Tong and Jahr, 1994; Tang et al., 1994; Frerking et al., 1995; Silver et al., 1996; Nusser et al., 1997;Chen et al., 2002), depending on synaptic morphology and receptor properties. Although the properties of GABAAreceptors at this synapse have not been studied, cerebellar nuclear IPSCs decayed quickly compared with other GABAergic synapses (Jones and Westbrook, 1993; Varela et al., 1999; Banks and Pearce, 2000; Kraushaar and Jonas, 2000; Lu and Trussell, 2000), suggestive of relatively rapid deactivation and/or desensitization kinetics. If GABAA receptors of nuclear cells accumulate in desensitized states with repeated stimulation, the kinetics of recovery from desensitization could participate in determining the profile of synaptic depression. Desensitization could reduce the number of available receptors (Overstreet et al., 2000) or possibly contribute to tonic IPSCs by prolonging the response of receptors (Jones and Westbrook, 1993).
Modulation of release by neurotransmitters may be another factor that regulates depression at this synapse. Our data suggest that mGluR activation is unlikely to shape depression significantly. A more likely possibility is that release may be modulated by GABAB receptors (Kreitzer and Regehr, 2000; Hefft et al., 2002), although in cerebellar slice cultures, GABAB antagonists did not affect cerebellar nuclear IPSPs evoked by brief trains (Mouginot and Gähwiler, 1995).
Depression and synaptic plasticity
Finally, IPSCs at this synapse are subject to long-term depression and potentiation. Factors influencing the direction of plasticity include the stimulation rate as well as the postsynaptic calcium influx (Morishita and Sastry, 1996; Aizenman et al., 1998;Ouardouz and Sastry, 2000). An interesting possibility is that the spontaneous firing of Purkinje cells and the consequent synaptic depression of their terminals may modify the stimulus patterns necessary to elicit the long-term synaptic changes that are involved in cerebellar plasticity.
Footnotes
This work was supported by the Searle Foundation, the Sloan Foundation, and National Institutes of Health Grant NS39395 (I.M.R.). We thank Dr. Jeff Diamond and Dr. Chinfei Chen for useful comments on this manuscript. I.M.R. also acknowledges Dr. Michael Häusser's collaboration in a set of preliminary experiments.
Correspondence should be addressed to Indira M. Raman, Department of Neurobiology and Physiology, 2153 North Campus Drive, Northwestern University, Evanston, IL 60208. E-mail: [email protected].
REFERENCES
- 1.Abbott LF, Varela JA, Sen K, Nelson SB. Synaptic depression and cortical gain control. Science. 1997;275:220–224. doi: 10.1126/science.275.5297.221. [DOI] [PubMed] [Google Scholar]
- 2.Aizenman CD, Linden DJ. Regulation of the rebound depolarization and spontaneous firing patterns of deep nuclear neurons in slices of rat cerebellum. J Neurophysiol. 1999;82:1697–1709. doi: 10.1152/jn.1999.82.4.1697. [DOI] [PubMed] [Google Scholar]
- 3.Aizenman CD, Linden DJ. Rapid, synaptically driven increases in the intrinsic excitability of cerebellar deep nuclear neurons. Nat Neurosci. 2000;3:109–111. doi: 10.1038/72049. [DOI] [PubMed] [Google Scholar]
- 4.Aizenman CD, Manis PB, Linden DJ. Polarity of long-term synaptic gain change is related to postsynaptic spike firing at a cerebellar inhibitory synapse. Neuron. 1998;21:827–835. doi: 10.1016/s0896-6273(00)80598-x. [DOI] [PubMed] [Google Scholar]
- 5.Anchisi D, Scelfo B, Tempia F. Postsynaptic currents in deep cerebellar nuclei. J Neurophysiol. 2001;85:323–331. doi: 10.1152/jn.2001.85.1.323. [DOI] [PubMed] [Google Scholar]
- 6.Banks MI, Pearce RA. Kinetic differences between synaptic and extrasynaptic GABA(A) receptors in CA1 pyramidal cells. J Neurosci. 2000;20:937–948. doi: 10.1523/JNEUROSCI.20-03-00937.2000. [DOI] [PMC free article] [PubMed] [Google Scholar]
- 7.Bäurle J, Grüsser-Cornehls U. Differential number of glycine- and GABA-immunopositive neurons and terminals in the deep cerebellar nuclei of normal and Purkinje cell degeneration mutant mice. J Comp Neurol. 1997;382:443–458. [PubMed] [Google Scholar]
- 8.Chan-Palay V. Cerebellar dentate nucleus. Organization, cytology, and transmitters. Berlin; Springer: 1977. [Google Scholar]
- 9.Chen C, Blitz DM, Regehr W. Contributions of receptor desensitization and saturation to plasticity at the retinogeniculate synapse. Neuron. 2002;33:779–788. doi: 10.1016/s0896-6273(02)00611-6. [DOI] [PubMed] [Google Scholar]
- 10.Chen S, Hillman DE. Colocalization of neurotransmitters in the deep cerebellar nuclei. J Neurocytol. 1993;22:81–91. doi: 10.1007/BF01181572. [DOI] [PubMed] [Google Scholar]
- 11.Crépel F. Maturation of the cerebellar Purkinje cells. I. Postnatal evolution of the Purkinje cell spontaneous firing in the rat. Exp Brain Res. 1972;14:463–471. [Google Scholar]
- 12.Czubayko U, Sultan F, Thier P, Schwarz C. Two types of neurons in the rat cerebellar nuclei as distinguished by membrane potentials and intracellular fillings. J Neurophysiol. 2001;85:2017–2029. doi: 10.1152/jn.2001.85.5.2017. [DOI] [PubMed] [Google Scholar]
- 13.Dittman JS, Kreitzer AC, Regehr WG. Interplay between facilitation, depression, and residual calcium at three presynaptic terminals. J Neurosci. 2000;20:1374–1385. doi: 10.1523/JNEUROSCI.20-04-01374.2000. [DOI] [PMC free article] [PubMed] [Google Scholar]
- 14.Frerking M, Borges S, Wilson M. Variation in GABA mini amplitude is the consequence of variation in transmitter concentration. Neuron. 1995;15:885–895. doi: 10.1016/0896-6273(95)90179-5. [DOI] [PubMed] [Google Scholar]
- 15.Galarreta M, Hestrin S. Frequency-dependent synaptic depression and the balance of excitation and inhibition in the neocortex. Nat Neurosci. 1998;1:587–594. doi: 10.1038/2822. [DOI] [PubMed] [Google Scholar]
- 16.Gauck V, Jaeger D. The control of rate and timing of spikes in the deep cerebellar nuclei by inhibition. J Neurosci. 2000;20:3006–3016. doi: 10.1523/JNEUROSCI.20-08-03006.2000. [DOI] [PMC free article] [PubMed] [Google Scholar]
- 17.Gauck V, Thomann M, Jaeger D, Borst A. Spatial distribution of low- and high-voltage-activated calcium currents in neurons of the deep cerebellar nuclei. J Neurosci. 2001;21:RC158. doi: 10.1523/JNEUROSCI.21-15-j0004.2001. [DOI] [PMC free article] [PubMed] [Google Scholar]
- 18.Gilbert PF, Thach WT. Purkinje cell activity during motor learning. Brain Res. 1977;128:309–328. doi: 10.1016/0006-8993(77)90997-0. [DOI] [PubMed] [Google Scholar]
- 19.Granit R, Phillips CG. Excitatory and inhibitory processes acting upon individual Purkinje cells of the cerebellum in cats. J Physiol (Lond) 1956;133:520–547. doi: 10.1113/jphysiol.1956.sp005606. [DOI] [PMC free article] [PubMed] [Google Scholar]
- 20.Gupta A, Wang Y, Markram H. Organizing principles for a diversity of GABAergic interneurons and synapses in the neocortex. Science. 2000;287:273–278. doi: 10.1126/science.287.5451.273. [DOI] [PubMed] [Google Scholar]
- 21.Häusser M, Clark BA. Tonic synaptic inhibition modulates neuronal output pattern and spatiotemporal synaptic integration. Neuron. 1997;19:665–678. doi: 10.1016/s0896-6273(00)80379-7. [DOI] [PubMed] [Google Scholar]
- 22.Hefft S, Kraushaar U, Geiger JRP, Jonas P. Presynaptic short-term depression is maintained during regulation of transmitter release at a GABAergic synapse in rat hippocampus. J Physiol (Lond) 2002;539:201–208. doi: 10.1113/jphysiol.2001.013455. [DOI] [PMC free article] [PubMed] [Google Scholar]
- 23.Hounsgaard J. Pacemaker properties of mammalian Purkinje cells. Acta Physiol Scand. 1979;106:91–92. doi: 10.1111/j.1748-1716.1979.tb06375.x. [DOI] [PubMed] [Google Scholar]
- 24.Jahnsen H. Electrophysiological characteristics of neurones in the guinea pig deep cerebellar nuclei in vitro. J Physiol (Lond) 1986a;372:129–147. doi: 10.1113/jphysiol.1986.sp016001. [DOI] [PMC free article] [PubMed] [Google Scholar]
- 25.Jahnsen H. Extracellular activation and membrane conductances of neurones in the guinea-pig deep cerebellar nuclei in vitro. J Physiol (Lond) 1986b;372:149–168. doi: 10.1113/jphysiol.1986.sp016002. [DOI] [PMC free article] [PubMed] [Google Scholar]
- 26.Jones MV, Westbrook GL. Desensitized states prolong GABAA channel responses to brief agonist pulses. Neuron. 1993;15:181–191. doi: 10.1016/0896-6273(95)90075-6. [DOI] [PubMed] [Google Scholar]
- 27.Kraushaar U, Jonas P. Efficacy and stability of quantal GABA release at a hippocampal interneuron-principal neuron synapse. J Neurosci. 2000;20:5594–5607. doi: 10.1523/JNEUROSCI.20-15-05594.2000. [DOI] [PMC free article] [PubMed] [Google Scholar]
- 28.Kreitzer AC, Regehr WG. Modulation of transmission during trains at a cerebellar synapse. J Neurosci. 2000;20:1348–1357. doi: 10.1523/JNEUROSCI.20-04-01348.2000. [DOI] [PMC free article] [PubMed] [Google Scholar]
- 29.Lang EJ, Sugihara I, Welsh JP, Llinas R. Patterns of spontaneous Purkinje cell complex spike activity in the awake rat. J Neurosci. 1999;19:2728–2739. doi: 10.1523/JNEUROSCI.19-07-02728.1999. [DOI] [PMC free article] [PubMed] [Google Scholar]
- 30.LeDoux MS, Hurst DC, Lorden JF. Single-unit activity of cerebellar nuclear cells in the awake genetically dystonic rat. Neuroscience. 1998;86:533–545. doi: 10.1016/s0306-4522(98)00007-4. [DOI] [PubMed] [Google Scholar]
- 31.Llinás R, Mühlethaler M. Electrophysiology of guinea pig cerebellar nuclear cells in the in vitro brainstem-cerebellar preparation. J Physiol (Lond) 1988;404:241–258. doi: 10.1113/jphysiol.1988.sp017288. [DOI] [PMC free article] [PubMed] [Google Scholar]
- 32.Llinás R, Sugimori M. Electrophysiological properties of in vitro Purkinje cell somata in mammalian cerebellar slices. J Physiol (Lond) 1980;305:171–195. doi: 10.1113/jphysiol.1980.sp013357. [DOI] [PMC free article] [PubMed] [Google Scholar]
- 33.Lu T, Trussell LO. Inhibitory transmission mediated by asynchronous transmitter release. Neuron. 2000;26:683–694. doi: 10.1016/s0896-6273(00)81204-0. [DOI] [PubMed] [Google Scholar]
- 34.McCormick DA, Thompson RF. Neuronal responses of the rabbit cerebellum during acquisition and performance of a classically conditioned nictitating membrane-eyelid response. J Neurosci. 1984;4:2811–2822. doi: 10.1523/JNEUROSCI.04-11-02811.1984. [DOI] [PMC free article] [PubMed] [Google Scholar]
- 35.McDevitt CJ, Ebner TJ, Bloedel JR. Relationships between simultaneously recorded Purkinje cells and nuclear neurons. Brain Res. 1987;425:1–13. doi: 10.1016/0006-8993(87)90477-x. [DOI] [PubMed] [Google Scholar]
- 36.Medina JF, Mauk MD. Simulations of cerebellar motor learning: computational analysis of plasticity at the mossy fiber to deep nucleus synapse. J Neurosci. 1999;19:7140–7151. doi: 10.1523/JNEUROSCI.19-16-07140.1999. [DOI] [PMC free article] [PubMed] [Google Scholar]
- 37.Medina JF, Garcia KS, Mauk MD. A mechanism for savings in the cerebellum. J Neurosci. 2001;21:4081–4089. doi: 10.1523/JNEUROSCI.21-11-04081.2001. [DOI] [PMC free article] [PubMed] [Google Scholar]
- 38.Medina JF, Repa C, Mauk MD, LeDoux JE. Parallels between cerebellum- and amygdala-dependent conditioning. Nat Neurosci. 2002;3:122–131. doi: 10.1038/nrn728. [DOI] [PubMed] [Google Scholar]
- 39.Monaghan PL, Beitz AJ, Larson AA, Altschuler JE, Madl JE, Mullett MA. Immunocytochemical localization of glutamate-, glutaminase-, and aspartate aminotransferase-like immunoreactivity in the rat deep cerebellar nuclei. Brain Res. 1986;363:364–370. doi: 10.1016/0006-8993(86)91024-3. [DOI] [PubMed] [Google Scholar]
- 40.Morishita W, Sastry BR. Postsynaptic mechanisms underlying long-term depression of GABAergic transmission in neurons of the cerebellar nuclei. J Neurophysiol. 1996;76:59–68. doi: 10.1152/jn.1996.76.1.59. [DOI] [PubMed] [Google Scholar]
- 41.Mouginot D, Gähwiler BH. Characterization of synaptic connections between cortex and deep nuclei of the rat cerebellum in vitro. Neuroscience. 1995;64:699–712. doi: 10.1016/0306-4522(94)00456-f. [DOI] [PubMed] [Google Scholar]
- 42.Nusser Z, Cull-Candy S, Farrant M. Differences in synaptic GABA(A) receptor number underlie variation in GABA mini amplitude. Neuron. 1997;19:697–709. doi: 10.1016/s0896-6273(00)80382-7. [DOI] [PubMed] [Google Scholar]
- 43.Ouardouz M, Sastry BR. Mechanisms underlying LTP of inhibitory synaptic transmission in the deep cerebellar nuclei. J Neurophysiol. 2000;84:1414–1421. doi: 10.1152/jn.2000.84.3.1414. [DOI] [PubMed] [Google Scholar]
- 44.Overstreet LV, Jones MV, Westbrook GL. Slow desensitization regulates the availability of synaptic GABAA receptors. J Neurosci. 2000;20:7914–7921. doi: 10.1523/JNEUROSCI.20-21-07914.2000. [DOI] [PMC free article] [PubMed] [Google Scholar]
- 45.Palkovits M, Mezey E, Hamori J, Szentagothai J. Quantitative histological analysis of the cerebellar nuclei in the cat. I. Numerical data on cells and on synapses. Exp Brain Res. 1977;28:189–209. doi: 10.1007/BF00237096. [DOI] [PubMed] [Google Scholar]
- 46.Raman IM, Bean BP. Resurgent sodium current and action potential formation in dissociated cerebellar Purkinje neurons. J Neurosci. 1997;17:4517–4526. doi: 10.1523/JNEUROSCI.17-12-04517.1997. [DOI] [PMC free article] [PubMed] [Google Scholar]
- 47.Raman IM, Gustafson AE, Padgett D. Ionic currents and spontaneous firing in neurons isolated from the cerebellar nuclei. J Neurosci. 2000;20:9004–9016. doi: 10.1523/JNEUROSCI.20-24-09004.2000. [DOI] [PMC free article] [PubMed] [Google Scholar]
- 48.Raymond JL, Lisberger SG, Mauk MD. The cerebellum: a neuronal learning machine? Science. 1996;272:1126–1131. doi: 10.1126/science.272.5265.1126. [DOI] [PubMed] [Google Scholar]
- 49.Sakaba T, Neher E. Calmodulin mediates rapid recruitment of fast-releasing synaptic vesicles at a calyx-type synapse. Neuron. 2001;32:1119–1131. doi: 10.1016/s0896-6273(01)00543-8. [DOI] [PubMed] [Google Scholar]
- 50.Schmolesky MT, Weber JT, Hansel C (2002) The making of a complex spike: ionic composition and plasticity. Ann NY Acad Sci, in press. [DOI] [PubMed]
- 51.Sekirnjak C, du Lac S. Intrinsic firing dynamics of vestibular nucleus neurons. J Neurosci. 2002;22:2083–2095. doi: 10.1523/JNEUROSCI.22-06-02083.2002. [DOI] [PMC free article] [PubMed] [Google Scholar]
- 52.Shinoda Y, Izawa Y, Sugiuchi Y, Futami T. Functional significance of excitatory projections from the precerebellar nuclei to interpositus and dentate nucleus neurons for mediating motor, premotor, and parietal cortical inputs. Prog Brain Res. 1997;114:193–207. doi: 10.1016/s0079-6123(08)63365-8. [DOI] [PubMed] [Google Scholar]
- 53.Silver RA, Cull-Candy SG, Takahashi T. Non-NMDA glutamate receptor occupancy and open probability at a rat cerebellar synapse with single and multiple release site. J Physiol (Lond) 1996;494:231–250. doi: 10.1113/jphysiol.1996.sp021487. [DOI] [PMC free article] [PubMed] [Google Scholar]
- 54.Tang C-M, Margulis M, Shi Q-Y, Fielding A. Saturation of postsynaptic glutamate receptors after quantal release of transmitter. Neuron. 1994;13:1385–1393. doi: 10.1016/0896-6273(94)90423-5. [DOI] [PubMed] [Google Scholar]
- 55.Teune TM, van der Burg J, dez Eeuw CI, Voogd J, Ruigrok TJ. Single Purkinje cell can innervate multiple classes of projection neurons in the cerebellar nuclei of the rat: a light microscopic and ultrastructural triple-tracer study in the rat. J Comp Neurol. 1998;392:164–178. doi: 10.1002/(sici)1096-9861(19980309)392:2<164::aid-cne2>3.0.co;2-0. [DOI] [PubMed] [Google Scholar]
- 56.Thach WT. Discharge of cerebellar neurons during rapidly alternating arm movements in the monkey. J Neurophysiol. 1968;31:785–797. doi: 10.1152/jn.1968.31.5.785. [DOI] [PubMed] [Google Scholar]
- 57.Thach WT, Goodkin HP, Keating JG. The cerebellum and the adaptive coordination of movement. Annu Rev Neurosci. 1992;15:403–442. doi: 10.1146/annurev.ne.15.030192.002155. [DOI] [PubMed] [Google Scholar]
- 58.Thier P, Dicke PW, Haas R, Barash S. Encoding of movement time by populations of cerebellar Purkinje cells. Nature. 2000;405:72–76. doi: 10.1038/35011062. [DOI] [PubMed] [Google Scholar]
- 59.Tong G, Jahr CE. Multivesicular release from excitatory synapses of cultured hippocampal neurons. Neuron. 1994;12:51–59. doi: 10.1016/0896-6273(94)90151-1. [DOI] [PubMed] [Google Scholar]
- 60.Varela JA, Song S, Turrigiano GG, Nelson SB. Differential depression at excitatory and inhibitory synapses in visual cortex. J Neurosci. 1999;19:4293–4304. doi: 10.1523/JNEUROSCI.19-11-04293.1999. [DOI] [PMC free article] [PubMed] [Google Scholar]
- 61.Wang L-Y, Kaczmarek L. High-frequency firing helps replenish the readily releasable pool of synaptic vesicles. Nature. 1998;394:384–388. doi: 10.1038/28645. [DOI] [PubMed] [Google Scholar]
- 62.Zucker RS, Regehr WG. Short-term synaptic plasticity. Annu Rev Physiol. 2002;64:355–405. doi: 10.1146/annurev.physiol.64.092501.114547. [DOI] [PubMed] [Google Scholar]